A Developer's Guide to the Safari Browser Console
Master the Safari browser console with this complete guide. Learn to enable, debug on macOS & iOS, and use powerful commands to streamline your workflow.
A Developer's Guide to the Safari Browser Console
The Safari browser console is a seriously powerful, built-in tool that often gets overlooked. It lets you get your hands dirty with a site's JavaScript, poke around the DOM, and see what's happening on the network, all without leaving the browser. It’s the core of Safari's Web Inspector—a command-line interface that gives you direct access to the webpage as it's running.
Why Mastering the Safari Browser Console Is Non-Negotiable
Look, I get it. Most of us live in Chrome DevTools. But pretending the Safari console doesn't exist is a huge mistake that leads to some of the most frustrating, browser-specific bugs you'll ever encounter. Issues that are completely silent in Chrome will often scream at you with clear error messages in Safari. This makes it an absolutely critical tool for building websites that work for everyone, not just Chrome users.
Learning to navigate the Safari console is a must-have skill for any serious web developer. It’s part of a broader toolkit of essential developer tools. Think of it as your first line of defense against those sneaky bugs that only seem to pop up for a huge chunk of your audience.
The Impact of Safari's Market Share
Safari’s Web Inspector has been a go-to for front-end developers since it first appeared way back in 2003. Its importance has only grown. Today, Safari holds a solid 17.62% of the global browser market share, making it the second most popular browser in the world.
In the US mobile market, that number jumps to over 55.21%. That means QA engineers and dev teams are constantly bumping up against its unique rendering engine and JavaScript quirks. We're talking about hundreds of millions of user sessions where a subtle console error can break the entire experience, often because Safari is much stricter about web standards than other browsers.
This massive user base is why a deep understanding of its console is crucial for:
- Front-End Developers: You need to build UIs that are solid and work everywhere, not just on your machine.
- QA Engineers: Your job is to find and report bugs across all major platforms, and Safari is a big one.
- Product Managers: You want every user to have a great experience, and you can't afford to ignore the millions on Safari.
A quick five-minute check in the Safari console can save you hours of head-scratching. It’s the difference between a bug report that says "the button is broken for some people" and one that says "we've got a
TypeErroron line 42 inmain.jswhen running on iOS."
From Frustration to Actionable Insights
Manually trying to reproduce bugs just to grab console logs is a painful and time-consuming part of the software bug life cycle. This is where modern tooling can be a lifesaver.
Tools like Monito, for example, are built to automatically capture those hard-to-find, Safari-specific console logs, network requests, and user interactions. It turns a vague, impossible-to-reproduce bug into a developer-ready ticket with all the context you need, speeding up the entire debugging workflow.
Getting into the Console on macOS and iOS
Before you can get your hands dirty in the Safari browser console, you have to unlock it. Apple tucks its developer tools away by default, so the first thing you need to do is enable the Develop menu. This menu is your gateway to the Web Inspector and all the powerful tools inside, including the console.
It’s a simple, one-time change that you'll only have to do once. After that, you're all set for any future debugging sessions.
Unlocking the Develop Menu on macOS
Getting this set up on your Mac is quick. Just pop open Safari's settings by going to Safari > Settings... in the menu bar.
From there, it’s just two clicks:
- Head over to the Advanced tab (it's the last one on the right).
- Look for the checkbox at the very bottom that says "Show features for web developers" and check it.
And that's it! A new "Develop" item will immediately appear in your Safari menu bar, right between "Bookmarks" and "Window."
My Favorite Shortcut: I always right-click the Safari toolbar and choose "Customize Toolbar...". Then, I drag the "Web Inspector" icon right up there. This gives me one-click access and saves me from digging through menus every single time.
With the Develop menu visible, opening the console is easy. Just right-click on any webpage and choose "Inspect Element". The keyboard shortcut Option + Command + I (⌥ + ⌘ + I) is also your best friend here.
Connecting to an iPhone or iPad for Remote Debugging
We've all been there: a bug that only shows up on an iPhone. This is where remote debugging becomes a lifesaver. You can use the full desktop Web Inspector on your Mac to poke around a live website running on your iPhone or iPad.
First, connect your iOS device to your Mac with a USB cable. The very first time you do this, you'll need to tap "Trust" on both devices to establish a secure connection.
Next, you need to flip a switch on the iOS device itself.
- Open the Settings app on your iPhone or iPad.
- Scroll down and tap into Safari.
- Go all the way to the bottom and select Advanced.
- Find the Web Inspector toggle and turn it on.
Now, jump back to Safari on your Mac. Click the Develop menu, and you should see the name of your connected iPhone or iPad listed. When you hover over it, you'll see every tab you have open in Safari on that device.
Just click the page you want to inspect, and a Web Inspector window will pop open on your Mac, tied directly to your mobile device. Now you have the full power of the Safari browser console to hunt down those tricky, device-specific bugs just as if they were happening on your desktop.
This flowchart gives you a good idea of how the console fits into a standard debugging workflow once an issue crops up.
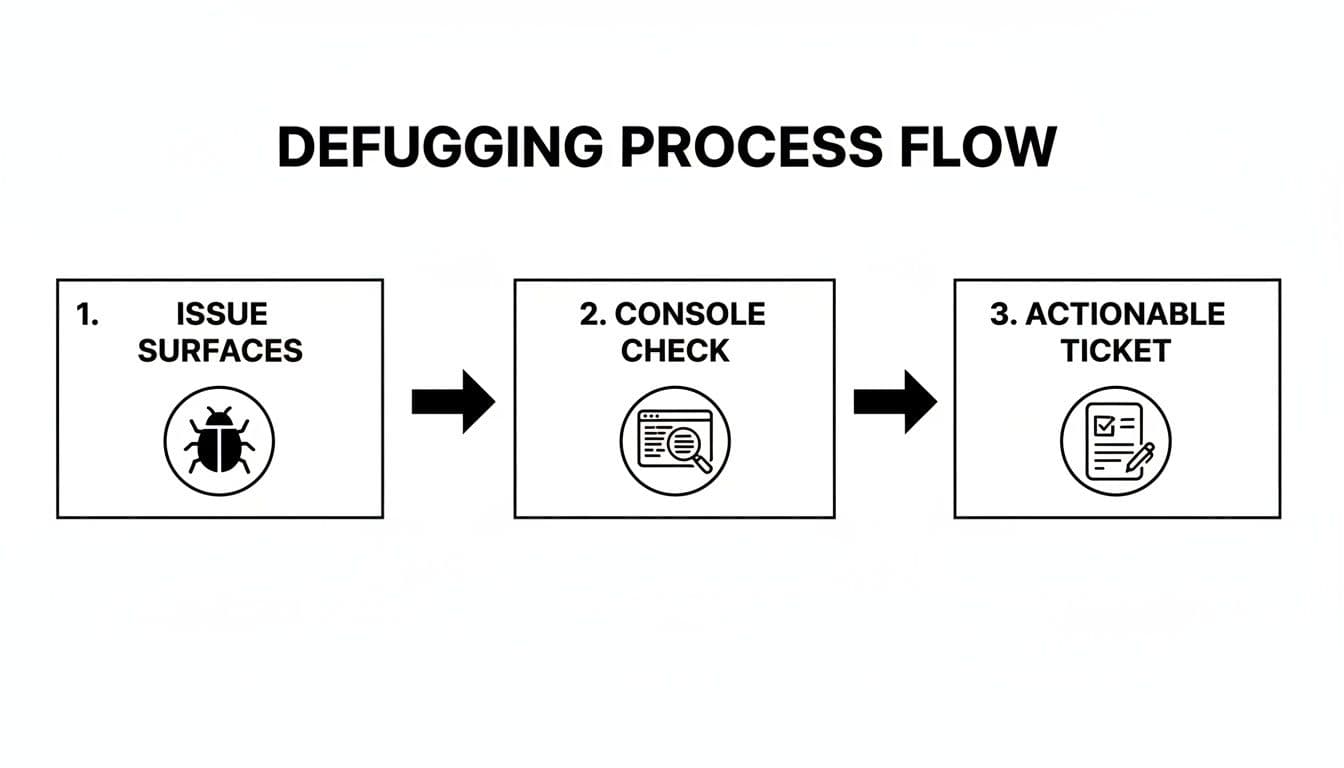
As you can see, just finding the issue is the start. The real investigation happens in the console, which is what allows you to turn a vague problem into a well-documented, actionable bug report.
Getting More Out of the Safari Console
Look, we all reach for console.log() first. It's the trusty hammer in our toolbox, and it gets the job done. But if you’re still only using console.log() to debug in Safari, you're essentially trying to build a house with just that one hammer.
There's a whole suite of powerful commands waiting for you in the console. Using them will take your debugging from a messy stream of text to a structured, insightful process. You’ll spend less time scrolling and more time understanding what your code is actually doing.
Stop Logging Objects, Start Tabling Them
Let's be honest: inspecting a big JSON response from an API as a collapsible object tree is a pain. This is where console.table() becomes your best friend. It takes an array or an object and renders it as a clean, sortable table right in your console.
Say you're working with a list of users. Instead of a giant, nested log, you can do this:
const users = [ { id: 1, name: "Alice", role: "Admin", lastLogin: "2024-08-15" }, { id: 2, name: "Bob", role: "Editor", lastLogin: "2024-08-14" }, { id: 3, name: "Charlie", role: "Viewer", lastLogin: "2024-08-16" }, ];
console.table(users);
Just like that, you get a beautiful table. You can even click the headers for id, name, or lastLogin to sort the data on the fly. It's a game-changer for quickly making sense of complex data.
Bring Order to the Chaos with Groups
When you're tracing something complex, like a component's lifecycle in React or a series of asynchronous calls, the console can turn into a waterfall of disconnected messages. This is where log grouping saves the day.
The console.group() and console.groupEnd() commands let you create collapsible, indented sections to organize your output logically.
console.group('Component Mounting'): Starts a new, expanded group. All subsequent logs will be indented inside it.console.groupCollapsed('Fetching User Data'): Does the same but starts the group in a collapsed state, which is great for keeping your initial view clean.console.groupEnd(): Closes the current group, moving subsequent logs back out a level.
This creates a clear, hierarchical view of your application's flow, making it much easier to follow along. Organized logging is a core part of effective debugging, which we explore further in our guide to handling JavaScript errors.
Smarter Logging for Conditions and Performance
A couple of other commands are essential for leveling up your workflow: console.assert() and console.time().
console.assert(assertion, message) is perfect for clean conditional checks. It only logs the message if its first argument is false. This lets you check for unexpected states or bad data without cluttering your code with if statements just for logging.
And when you need to track down performance bottlenecks, console.time() and console.timeEnd() are invaluable. Just start a timer with a unique label, run your code, and then stop the timer with the same label.
// Let's see how long this takes console.time('Image Processing');
// ... your heavy image processing logic runs here ...
// Stop the timer and see the result console.timeEnd('Image Processing'); // Output will be something like: Image Processing: 345.12ms It's a dead-simple way to get precise timing information and figure out which parts of your code need a tune-up.
Key Takeaway: Moving beyond
console.logisn't optional for serious debugging. Get comfortable withconsole.tablefor data,console.groupfor organization, andconsole.timefor performance. You'll find and fix bugs faster.
Mastering these tools is more important than ever. Safari now powers 13.87% of mobile browsing globally and a staggering 55.21% in the US. Developers can't ignore it. It’s also good to know its quirks; for instance, Safari's console can sometimes show 15-20% fewer network requests in filtered views than Chrome's, which can be a real head-scratcher during bug hunts. As you discover more insights about browser market share on BrowserStack.com, it’s clear that knowing every corner of the Safari console is critical for shipping solid code to a huge audience.
Taking Your Debugging to the Next Level with Remote Inspection
Once you're comfortable with the basics of the console, it's time to get into the really powerful stuff. This is where you graduate from just logging messages to hunting down those tricky, device-specific bugs that you can't seem to replicate on your desktop. The star of the show here is remote inspection, which lets you plug an iOS device directly into your Mac and see exactly what's happening under the hood.
This workflow is an absolute game-changer. Think about those frustrating bugs: a button that works everywhere but on an iPhone, or a layout that completely falls apart on an iPad. Remote debugging makes them tangible and, more importantly, fixable. By tethering your device, you get full access to the Web Inspector, allowing you to live-edit CSS, set JavaScript breakpoints, and poke around the DOM just as if the site were running locally.
Diving into Remote Debugging on iOS
Getting started is straightforward. Just connect your iPhone or iPad to your Mac with a USB cable. As long as you've enabled the Web Inspector on both devices, your mobile device will pop up in Safari’s Develop menu on your Mac. Clicking it launches a dedicated Web Inspector window that mirrors the web content from your physical device in real time.
This isn't just a read-only view; it’s a fully interactive debugging session. Any changes you make in the Web Inspector on your Mac are instantly reflected on the iPhone's screen.
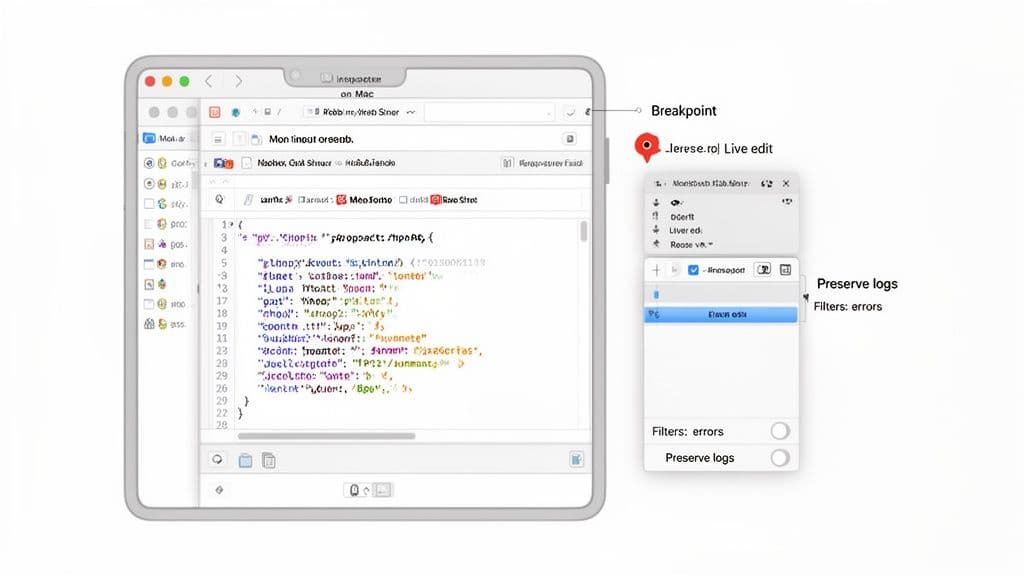
- Live Edit CSS: Jump into the Elements tab to tweak styles on the fly. This is perfect for perfecting mobile layouts without the endless cycle of saving code and refreshing the page.
- Set JavaScript Breakpoints: In the Sources tab, you can pause script execution at critical moments. This lets you inspect variables and get a clear picture of your application's state at that exact point.
- Monitor Network Traffic: Head over to the Network tab to watch API calls and other resources load, helping you diagnose performance bottlenecks that only appear on mobile.
I once spent days chasing a bug where a modal window wouldn't scroll on certain iPhones. I couldn't reproduce it in any simulator. Remote debugging was the only way I could inspect the live CSS on the actual device and finally find a rogue
overflow: hiddenproperty being applied by a third-party script only at that specific screen size.
Mastering Console Filtering and Log Preservation
A busy web app can absolutely flood the console with messages, making it hard to find what you’re looking for. This is where Safari's filtering tools become your best friend. The console toolbar lets you quickly isolate messages by type, cutting through the noise.
You can easily toggle the view to show only:
- Errors: The critical issues that are most likely breaking your site.
- Warnings: Potential problems or uses of deprecated APIs.
- Logs: Your standard
console.log()output.
Beyond these presets, there's a search bar for filtering by any text. A great pro-tip is to prefix your own debug messages with a unique tag, like [CheckoutFlow]. That way, you can type that into the filter and see only the logs relevant to that specific feature. It’s a small habit that saves a ton of time.
Keeping Your Logs Across Page Navigations
One of the most annoying things is losing your entire console history the moment you click a link or submit a form. By default, the console clears itself on every page navigation. To stop this, you need to enable the Preserve Log feature.
You'll find this checkbox in the Network tab of the Web Inspector. Even though it lives there, its effect is global—it also keeps the Console tab from clearing as you navigate between pages. This setting is non-negotiable when you're debugging a multi-step user flow, like an e-commerce checkout or an onboarding sequence.
Why This All Matters for the Modern Web
Getting a handle on these advanced features isn't just about convenience; it's a professional necessity. A quick look at Safari browser console stats shows why. While its overall market share dipped in 2022, it came back strong to claim 18.59% by 2023. On mobile, its dominance in certain markets is staggering—it holds a 55.21% share in the US, easily dwarfing Chrome.
This means that for developers in North America, nearly one in every five web sessions is happening in Safari. With the Safari iPhone version alone responsible for 11.95% of all traffic, tools like remote inspection are absolutely vital for building the polished, bug-free experiences users expect. You can dig deeper into these trends by exploring browser market share data on Yaguara.co.
Safari Console vs Chrome DevTools Common Differences
For developers who frequently switch between browsers, it’s helpful to know the subtle (and not-so-subtle) differences between Safari's Web Inspector and Chrome's DevTools. While they share many core features, their implementation and behavior can vary.
| Feature/Behavior | Safari Web Inspector | Chrome DevTools | Key Takeaway for Developers |
|---|---|---|---|
| Preserve Log Location | Found in the Network tab. | Found directly in the Console tab's settings. | A common point of confusion. Remember to check the Network tab in Safari. |
| Object Logging | Logs a snapshot of the object's state at the time of logging. | Logs a live reference. The displayed value updates if the object changes. | This can lead to different outputs for the same code. Safari's approach is often less confusing for tracking state changes over time. |
| Live Expressions | Not available. You must re-run expressions manually. | Supports "Live Expressions" that update in real-time. | For monitoring a value that changes frequently, you'll need to re-evaluate it manually in Safari's console. |
| Remote Debugging | Requires a physical USB connection to an iOS device. | Offers more flexible options, including wireless debugging for Android. | Safari's remote debugging is powerful but strictly tied to the Apple ecosystem and requires a physical cable. |
| Performance Profiling | The "Timelines" tab offers detailed performance recording. | The "Performance" tab is incredibly robust with features like flame charts. | Both are powerful, but Chrome's tools are often considered more feature-rich for deep performance analysis. |
Ultimately, understanding these differences helps you adapt your debugging workflow more efficiently, saving you from the frustration of expecting one tool to behave exactly like the other.
Turning Console Logs Into Actionable Bug Reports
So, you’ve found a bug using the Safari console. That's a solid start, but it's only half the job. The real challenge is getting that bug fixed, and that means writing a bug report so clear that a developer can instantly see what’s wrong without a dozen follow-up questions.
This is where you move from just finding problems to actually solving them. A raw copy-paste of an error message is almost never enough. Context is king.
How to Properly Capture Console Logs
When you spot an issue, your first move should always be to preserve the evidence. Safari gives you a couple of ways to do this, but not all methods are created equal.
A classic mistake is taking a screenshot that only shows the one red error line. You've just cut off all the surrounding logs that might actually point to the root cause. Instead, make sure your screenshot captures the full picture, or even better, just save the whole log.
Here's how to export the log to a file:
- Right-click anywhere inside the console's log area.
- Choose Save Selected if you only need a few specific lines, or pick Save Log to export everything currently in view.
- This gives you a
.logfile you can attach directly to a ticket in Jira, Linear, or whatever tool your team uses.
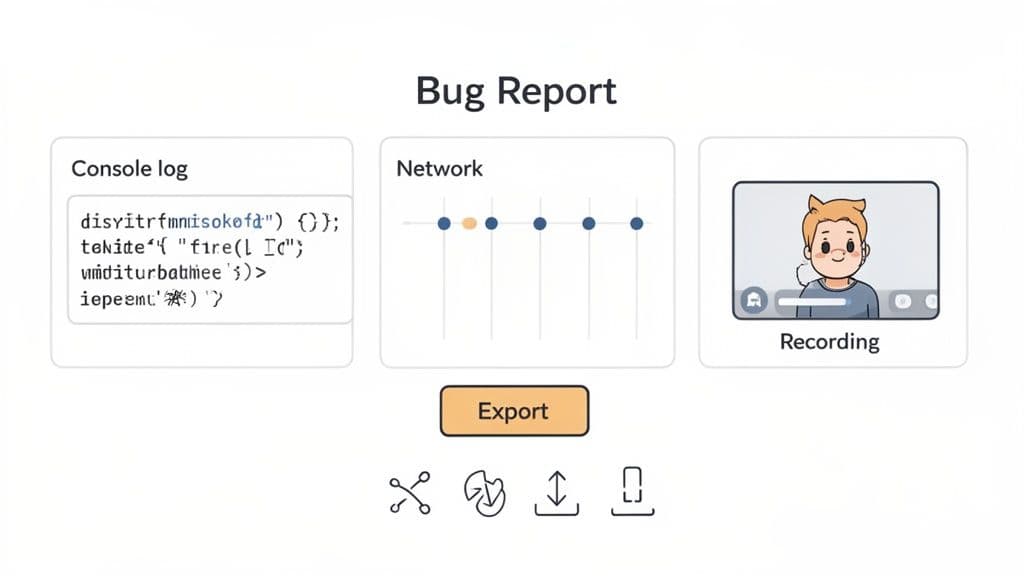
The best bug reports tell a complete story. They don't just say what broke; they show how it broke. The gold standard is combining console logs with a screen recording and a clear list of steps to reproduce the issue.
This approach turns a fuzzy complaint into a precise, developer-ready task. If you want to dive deeper into structuring these reports, take a look at our guide on creating a bug report template your engineers will actually appreciate.
Common Pitfalls to Avoid in Your Bug Reports
Even with good intentions, it's easy to create a bug report that misses the mark. The most common failure? A total lack of context. When a developer gets a log file with zero explanation, they're forced to play detective, guessing at what the user was trying to do.
Steer clear of these common traps:
- Forgetting the Steps to Reproduce: Don't ever assume the developer will magically know how to trigger the bug. Spell out the exact steps, clicks, and form inputs. Be painfully specific.
- Ignoring Network Requests: Sometimes the problem isn't in the JavaScript at all, but a failed API call. Always peek at the Network tab. If you see any requests with a 404 or 500 error, include that information in your report.
- Leaving Out Environment Details: A bug might only appear on a specific setup. Always include the Safari version, macOS or iOS version, and the device you're using. A bug on an iPhone 12 with iOS 17 might be non-existent on an iPhone 15 running iOS 18.
For teams looking to get more efficient, integrating console logs with bug tracking systems like Jira can be a huge time-saver by connecting the evidence directly to the ticket.
Automating the Process for Faster Fixes
Let's be honest: manually gathering all this information for every single bug is tedious and prone to human error. This is where modern debugging tools completely change the game by automating the entire capture process.
Tools like Monito are built to eliminate this grunt work. With a simple browser extension, it records the entire user session—every click, every keystroke, and every page they visit.
More importantly, it automatically grabs all the technical details a developer needs to see:
- Complete Console Logs: Every single error, warning, and custom
console.logis captured and timestamped. - Full Network Activity: All API requests and their responses are logged and available for inspection.
- Screen Recording: A video replay shows the developer exactly what the user saw and did.
This bundles everything into a comprehensive, shareable report with a single click. It's the difference between spending 20 minutes writing a bug ticket and spending 20 seconds. By giving developers a complete, unambiguous picture of what went wrong, you empower them to fix issues in a fraction of the time, which speeds up the entire development cycle.
Safari Console FAQs
Even after you get the hang of the basics, some tricky situations can pop up when you're deep in a debugging session. Let's tackle some of the most common questions developers and QA pros run into with the Safari console.
How Can I See iPhone Console Logs on a Windows PC?
This is a classic headache for teams running on mixed hardware. The short answer? You can't do it directly. Apple's remote debugging is a closed loop, designed to work exclusively between macOS and iOS.
But that doesn't mean you're stuck. You just have to get a little creative:
- Cloud Testing Platforms: Services like BrowserStack or Sauce Labs let you remotely access real iOS devices through your browser. You can drive Safari and see the console output, all from your Windows machine.
- Smarter Collaboration: Instead of just asking a Mac-using teammate to reproduce the bug, have them use a tool that records the entire session. When the console logs, network requests, and a video of the user's actions are all captured together, anyone on the team can debug the issue, no matter their OS.
Why Do My Console Logs Vanish When I Refresh the Page?
It’s a frustratingly common scenario: you’ve got the exact log you need, but a page reload wipes it all away. This is Safari’s default behavior—it clears the console on every new page load to give you a clean slate.
To keep your logs from disappearing, you need to enable Preserve Log.
Here's a pro-tip for anyone coming from Chrome: this setting isn't where you'd expect. Instead of looking in the Console tab, you need to click over to the Network tab in the Web Inspector. You'll find the "Preserve Log" checkbox there. Ticking it will keep your console history safe across page reloads and navigations.
Can Browser Extensions Capture Safari Console Logs?
Not in the same way they do on Chrome. Safari's extension ecosystem is completely separate from Chromium-based browsers. An extension from the Chrome Web Store simply won't work in Safari. You'd need a dedicated Safari Web Extension from the Mac App Store.
So, while you might not find a direct "log capturing" extension, the goal is to create a complete debugging package. For Safari-specific bugs, the best workflow is often for a team member on a Mac to replicate the issue while recording their screen and then manually export the console logs. Combining those two gives a developer a much clearer picture.
What’s the Best Way to Share Console Errors with My Team?
A single, lonely error message copy-pasted into a ticket is rarely enough to go on. To help your developers actually fix the problem, context is king.
Here’s how to level up your bug reports:
- Good: A screenshot of the whole browser window. This shows the visual bug on the page right next to the corresponding errors in the console.
- Better: The full console log file. Just right-click inside the console, choose "Save Log," and attach the resulting
.logfile to your bug report. - Best: A complete diagnostic report. Modern bug reporting tools can automatically capture everything in one go: the console logs, network activity, user actions, and even a video replay of the session.
This last approach turns a simple bug report into a detailed, reproducible story of what went wrong, which drastically cuts down on the back-and-forth and gets issues resolved much, much faster.
At Monito, we're obsessed with making bug reporting painless. Our tool automatically captures the console logs, network requests, and user steps that lead to a bug, creating a developer-ready report in one click. Stop wasting time trying to reproduce issues and start fixing them faster. Try Monito for free.