A Practical Guide to Handling JavaScript Errors
Master handling JavaScript errors with this practical guide. Learn to debug, log, and fix bugs faster with proven strategies and modern tools for developers.
A Practical Guide to Handling JavaScript Errors
When it comes to JavaScript errors, most teams are stuck in a "break-fix" cycle. You wait for something to go wrong, then you scramble to fix it. But what if you could get ahead of the bugs? A truly effective strategy means shifting from being reactive to being proactive, using tools like try...catch not just to stop crashes, but to understand what’s really happening in your application.
This isn't just about cleaner code. It's about preventing silent failures, protecting the trust you've built with your users, and ultimately, safeguarding your revenue.
Why Proactive Error Handling Is a Game Changer
Let's get real for a second—unhandled JavaScript errors do more than just make your console angry. They are silent killers of conversion rates and user trust. Most of the time, you won't even know they're happening.
Picture this: a customer is on your checkout page, ready to buy. They click "Pay Now," and... nothing. The button is dead, thanks to a null reference error. They won't file a bug report. They'll just close the tab and buy from your competitor.
This isn't a rare occurrence; it's a daily reality for most web applications. The real cost of a bug isn't just the developer hours spent on a fix. It's the lost sales, the frustrated users who never come back, and the slow erosion of your brand's reputation. A single, nagging error in a critical path like login or checkout can have a massive financial ripple effect.
Shifting from Reactive to Proactive
Being reactive means you're always on defense, waiting for angry user emails to tell you something is broken. By that point, the damage is done. A proactive approach to error handling flips this entire dynamic on its head. It’s about building a system that anticipates failure and gives you the full story, so you can fix issues before they blow up.
This change in mindset helps everyone on the team:
- Developers can stop wasting time trying to reproduce vague bug reports and focus on shipping features.
- Product Managers can launch new releases with confidence, knowing the user experience isn't quietly falling apart.
- Support Teams aren't buried under tickets about broken features, freeing them up to help customers with more important issues.
Think of error handling as a core feature of your application, not an afterthought. When you do, it stops being a technical chore and becomes a real strategic advantage—a direct investment in quality and customer happiness.
The Business Case for Robust Error Handling
When you start looking at error handling from a business perspective, its value becomes crystal clear. This isn't just about technical debt. It's about building a resilient and profitable product. A solid system for catching, logging, and analyzing errors gives you an incredible window into how your application actually performs in the wild.
For example, a sudden spike in errors on a specific mobile browser could signal a major compatibility problem cutting off an entire segment of your users. Without proactive monitoring, you might blame a dip in conversions on a recent marketing campaign, never realizing the true culprit is a bug.
At the end of the day, committing to proper JavaScript error handling is a commitment to your users and your bottom line. It's the foundation for building reliable and trustworthy applications that deliver a smooth experience and keep people coming back.
Your Toolkit for Catching JavaScript Errors
To get a real handle on JavaScript errors, you need a solid set of tools. It’s less about picking one and more about layering them to create a defense system. Each one plays a different role, from precisely handling issues you see coming to casting a wide safety net for the ones you don't.
The Classic: try...catch
The first tool most of us reach for is the try...catch...finally block. Think of it as your surgical tool, perfect for wrapping a specific piece of code you know is a bit risky. A classic example is parsing JSON from an API call—you never know if the data will be malformed, and you need a way to deal with that without killing the entire function.
function parseUserData(jsonString) { try { const user = JSON.parse(jsonString); console.log("User's name:", user.name); } catch (error) { // This block only runs if JSON.parse throws an error console.error("Failed to parse user data:", error.message); // You could show a UI message to the user here } finally { // This block runs regardless of success or failure console.log("Parsing attempt finished."); } }
// A valid JSON string parseUserData('{"name":"Alex"}');
// An invalid JSON string that will be caught parseUserData('{"name":Alex}');
The finally block is a lifesaver for cleanup. Need to hide a loading spinner or close a connection? Put it there. It guarantees the code runs whether the try block succeeded or threw an error.
Your Global Safety Net: window.onerror
While try...catch is great for known risks, what about the errors you didn’t anticipate? That null reference from a weird user interaction or a third-party script that suddenly fails isn’t going to be neatly wrapped in a try block. This is where window.onerror becomes your most valuable player.
It’s essentially a global event handler, a catch-all that fires for any uncaught runtime error that bubbles all the way up. Setting it up is simple and gives you a foundational layer of visibility into your application's health.
window.onerror = function (message, source, lineno, colno, error) { console.log("An uncaught error occurred!"); // Send this data to your logging service // { message, source, lineno, colno, stack: error?.stack } return true; // This stops the browser's default error message };
This one function gives you five crucial pieces of info:
- message: The error text itself (e.g., "Uncaught ReferenceError: myFunction is not defined").
- source: The URL of the script where things went wrong.
- lineno: The line number.
- colno: The column number.
- error: The actual Error object, which holds the all-important stack trace.
The stack trace inside the
errorobject is pure gold for debugging. It maps out the exact sequence of function calls that led to the crash, giving you a roadmap to the root cause. It's far more useful than just a message and line number.
As this decision tree shows, letting errors slip through the cracks isn't a passive mistake—it actively damages user trust and can tank your conversion rates. Proactive error handling is about protecting both the user experience and your app's integrity.
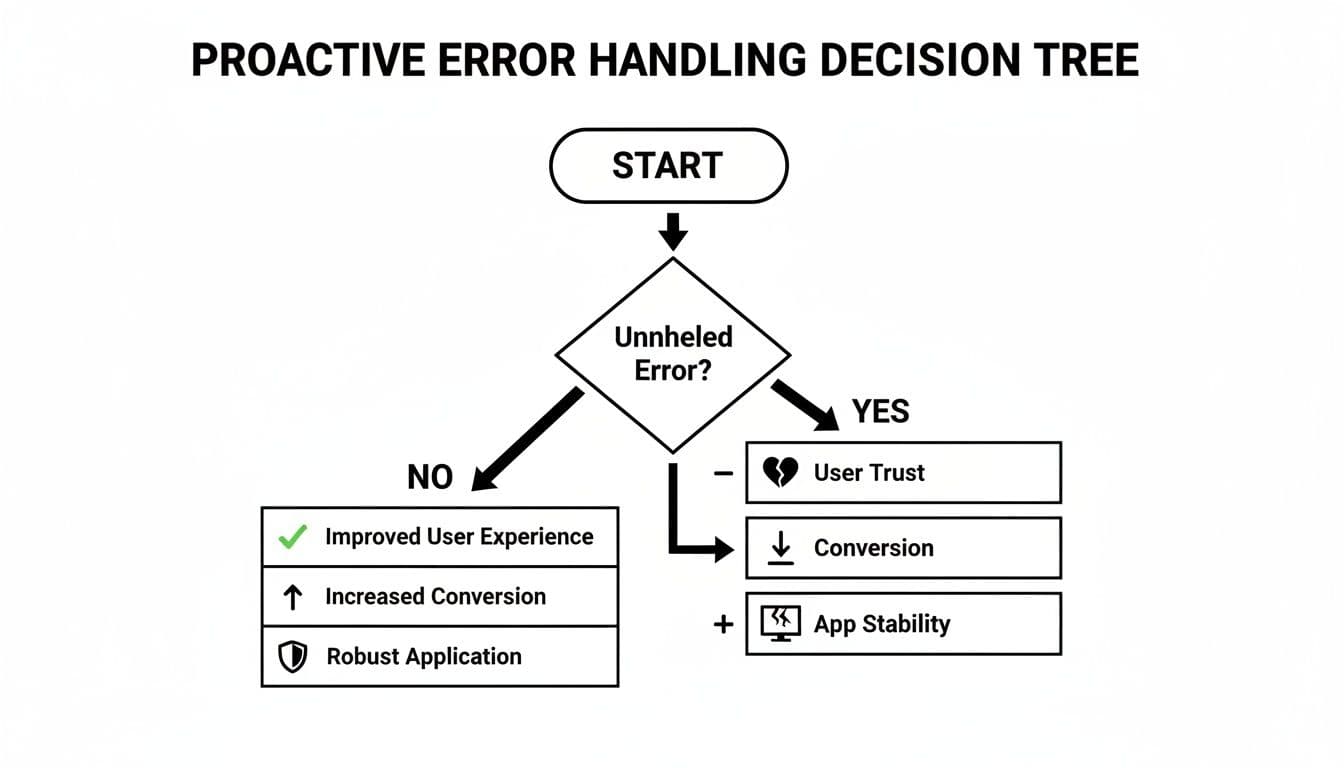
Ignoring errors is a choice that directly impacts your application and your business goals.
Taming Asynchronous Errors in Promises
Modern web apps are built on asynchronous operations, and this is where errors love to hide. Unhandled Promise rejections are a massive blind spot because they don't trigger window.onerror. Instead, they fire a completely different global event: unhandledrejection.
This can happen anywhere you use Promises, like with fetch calls or async/await syntax. If you forget to chain a .catch() block, that error just disappears into the void. You're left with a broken feature, a confused user, and absolutely no logs to tell you why.
Luckily, you can listen for these just like you do for synchronous errors.
window.addEventListener('unhandledrejection', function(event) { // The error object is in event.reason console.error('Unhandled Promise Rejection:', event.reason); // Log event.reason to your error tracking service });
// This will trigger the handler above Promise.reject(new Error('Something went wrong in an async operation!'));
The error details are tucked away in the event.reason property. By setting up handlers for both onerror and unhandledrejection, you’ve got almost all your bases covered, from synchronous code to async operations. For a more dedicated approach, specialized tools for JavaScript error monitoring can offer deeper insights.
This kind of broad coverage is non-negotiable today. I’ve seen QA engineers at fintech startups stumped by tickets with no reproduction steps, only to find out a WebSocket error was only happening on specific browsers under high-latency network conditions. While Chrome might account for 52% of JS errors, Safari (28%) and Firefox (12%) aren't far behind. The global average sits at 2.1 errors per 100 sessions on Android, and the rise of PWAs has only made things worse—unhandled Promise rejections now make up 37% of all reported incidents.
Moving Beyond console.log for Smarter Debugging
Catching an error is a great start, but it's just the beginning. A raw error message on its own often feels like a dead end, leaving you guessing about what actually went wrong. To get to the root of the problem and fix it fast, you have to ditch simple console.log() statements and start capturing a much richer set of clues.
Think of yourself as a detective arriving at a crime scene. A single clue is interesting, but it's the combination of evidence—fingerprints, witness statements, location details—that cracks the case. The same exact principle applies to debugging.
Gathering the Right Evidence
When an error pops up, your mission is to collect as much relevant information as you can, without crossing any privacy lines. This is how you transform a vague "Something went wrong" report into a bug ticket that a developer can actually act on.
So, what data is essential? Here’s what I always make sure to log:
- Stack Trace: This is your number one priority. The stack trace is a roadmap that shows the precise sequence of function calls leading up to the error. It's almost always the most valuable piece of the puzzle for figuring out the why.
- User Context: Who did this happen to? Knowing a user ID, their subscription plan, or what feature flags they have enabled can reveal critical patterns. An error that only affects your premium-tier customers is probably a five-alarm fire.
- Application State: What version of the app were they running? Was it
v2.1.3or the brand newv2.1.4you just pushed? Logging the commit hash or release version instantly tells you if a recent deployment is the likely culprit. - Environment Details: Details like the user's browser (Chrome, Safari), operating system (macOS, Windows), and device type (mobile, desktop) are crucial for reproducing the bug under the exact same conditions.
If you're looking to really level up your logging game, the strategies detailed in Mastering Debugging: How to Uncover Hidden Bugs Using Logs are a fantastic resource.
Taming the Noise with Error Grouping
One of the biggest headaches with basic error logging is the sheer volume of noise. If a single bug on your login page hits 1,000 users, you’re going to get a thousand separate, identical alerts. This kind of alert fatigue is real—it's how important issues get buried, and you eventually just start ignoring notifications.
This is exactly the problem that error grouping solves. The whole idea is to treat every instance of the same underlying bug as a single, trackable issue.
By intelligently grouping errors, you transform a chaotic flood of individual alerts into a prioritized list of unique problems. You can immediately see that "Issue A" happened 5,000 times, while "Issue B" only happened twice. Now you know what to fix first.
So, how does the grouping actually work? The trick is to create a unique "fingerprint" for each and every error.
How to Create a Unique Error Fingerprint
A solid fingerprint is usually just a combination of several data points, all hashed together into one unique ID. A really common and effective way to do this is by using key elements from the stack trace itself.
A straightforward approach looks something like this:
- First, you grab the
error.stackstring. - Next, you "normalize" it by stripping out the dynamic bits, like specific line and column numbers, which can change between builds even when the code logic hasn't. You want to focus on the stable parts, like function names and file paths.
- Finally, you generate a simple hash (like an MD5 or SHA-1) from that normalized string.
This hash becomes the unique identifier for that specific bug. The next time an error comes in, you just generate its fingerprint and check if you've seen it before.
| Fingerprint Component | Why It's Useful | Example Value |
|---|---|---|
| Error Message | Distinguishes between different error types. | TypeError |
| Top Stack Frame | Identifies the function that threw the error. | at login (auth.js) |
| File Path | Pinpoints the exact file where it happened. | /src/components/Login.js |
When you combine these elements, you get a really robust way to group identical issues. Suddenly, instead of a thousand alerts, your monitoring tool shows you one entry that says: "This error has occurred 1,000 times and affected 850 users." That’s the kind of data-driven insight that helps you prioritize the fixes that will have the biggest impact on your users.
How to Read Production Errors with Source Maps
So, you’ve got your error handlers set up and logs are flowing in. Great. But then you look at an error report from production and see a stack trace pointing to bundle.min.js:1:84271. That's not helpful. It’s just a pointer to a single, massive, machine-optimized line of code.
This is exactly where source maps come in and save the day.
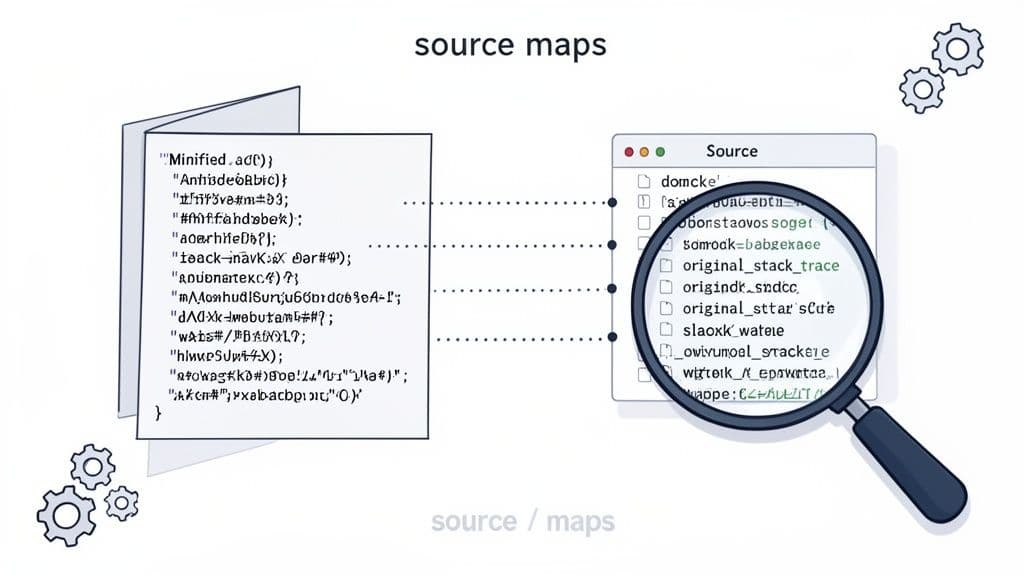
We minify and bundle our code for a reason—it’s a non-negotiable step for performance. But it mangles our beautiful, readable source code into something unrecognizable. A source map is essentially a decoder ring, a file that maps every single character in your optimized production code back to its original line and file. It’s what makes production stack traces actually useful.
With a source map, your error monitoring service can translate that gibberish. Suddenly, bundle.min.js:1:84271 becomes src/components/CheckoutForm.js:42:15, pointing you to the exact spot in the code you wrote. Now we're getting somewhere.
Configuring Your Build Tools for Source Maps
Thankfully, you don't have to build this translation layer from scratch. Most modern build tools like Vite or Webpack can generate source maps with a simple one-line change in your configuration.
If you're using Vite, just pop open your vite.config.js and enable it.
// vite.config.js import { defineConfig } from 'vite'
export default defineConfig({
build: {
sourcemap: true, // or 'hidden' for production
}
})
Working with Webpack? The process is just as straightforward in webpack.config.js.
// webpack.config.js
module.exports = {
// ... other configs
devtool: 'source-map',
};
The goal here is simple: get your bundler to spit out a .js.map file alongside every JavaScript bundle it creates. This file holds all the magic mapping data.
One critical piece of advice: Generate your source maps, but never serve them to the public. Exposing these files is like handing over your original, unminified source code, which can be a security risk. The correct workflow is to upload them directly to your error monitoring service as part of your deployment pipeline.
Choosing the Right Source Map Type
You’ll quickly notice that there isn't just one type of source map. The option you choose (like devtool in Webpack) is a trade-off between build speed and mapping quality.
Here’s a quick rundown of the most common options you'll encounter:
source-map: This is the gold standard for production. It generates a separate, high-quality.mapfile that gives you the most precise mapping possible.inline-source-map: This is handy for development. It bakes the entire source map into your JavaScript file as a base64 string. The downside? It makes your bundles enormous and is a terrible choice for production.hidden-source-map: This is another excellent production option. It creates the same high-quality.mapfile assource-mapbut crucially omits the reference to it in the JavaScript bundle. This prevents browsers from finding it, but your error monitoring service can still use it.eval-source-map: This is a fast-and-dirty option meant for development. It's quick to generate but offers a much lower quality map. Avoid it for production builds.
For debugging production errors, you’ll almost always want to stick with source-map or hidden-source-map. They provide the accuracy you need to hunt down bugs effectively without tanking your app's performance or creating security holes. Getting this one configuration right turns cryptic error logs into clear, actionable reports.
Automating Bug Reports to Fix Issues Faster
Let's be honest: the hardest part of fixing a bug isn't writing the code. It’s the soul-crushing back-and-forth trying to figure out what actually happened. We've all been there, staring at a vague ticket that just says, "The button is broken."
This communication gap is a massive time sink. You're left guessing the user's browser, what they clicked, or what data they entered. All that investigative work is time you could have spent building new features or squashing other critical issues.
The Pain of Manual Bug Reporting
The traditional bug reporting process is fundamentally broken. We put the burden of proof on the user—someone who's likely non-technical and already frustrated with our app. We expect them to remember their exact steps, take screenshots, and dig into a developer console they don't understand.
This friction always leads to two big problems:
- Incomplete Reports: Most tickets are missing the crucial technical details you need to even begin debugging.
- Unreported Bugs: Many users just give up. Rather than fight through the reporting process, they'll simply leave your application for good.
The result is an agonizingly slow process that frustrates everyone. Worse, it lets critical bugs hang around in production, affecting more users every day.
The bottleneck in software development isn't always the complexity of the code. More often than not, it's the inefficiency of the communication between the people who find bugs and the people who fix them.
This manual process feels like a relic. Modern tools can completely erase this friction by automatically capturing the full story of an error the moment it happens.
A Better Workflow with Automated Context
Imagine a world where every bug report lands on your desk with everything you need already attached. That's exactly what automated bug reporting tools, like the Monito browser extension, make possible. Instead of asking users to become detectives, these tools work quietly in the background.
When a user hits a snag, they can generate a comprehensive report with a single click. And this report isn't just a screenshot; it’s a complete diagnostic package that includes:
- A full session recording showing every click and interaction.
- Complete console logs (
log,warn, anderrormessages included). - A detailed record of all network requests and their responses.
- Rich environment details like browser version, OS, and screen resolution.
This approach turns bug reporting from a painful interrogation into a simple, one-click action.
From Vague Complaint to Actionable Ticket
To see the difference this makes, let’s compare the old way with the new way.
| Phase | Manual Reporting (Traditional) | Automated Reporting (with Monito) |
|---|---|---|
| User Action | Tries to remember steps, takes screenshots, writes a description. | Clicks the Monito extension, then clicks "Report." |
| Information | Vague description, maybe a cropped screenshot. | Full session video, console logs, network activity, environment data. |
| Developer Step 1 | Reads ticket, realizes it's incomplete. Emails user for more info. | Opens the ticket in Jira, sees the full report is already attached. |
| Developer Step 2 | Waits for a response (hours or days). Hopes the user remembers. | Watches the session replay to see the bug happen in real-time. |
| Developer Step 3 | Tries to reproduce the bug based on limited information. | Inspects console/network logs from the report to pinpoint the cause. |
| Time to Triage | Days | Minutes |
This table doesn't even account for the mental overhead and context switching. An automated workflow lets you stay focused on what matters: shipping a fix.
The impact on a team's velocity is huge. Consider a front-end dev at a SaaS startup whose app starts crashing for 15% of Chrome users due to a null reference error. Data from New Relic shows that apps with JavaScript error rates above 5% can see bounce rates jump by 23%. For a team using a tool like Monito, its Chrome extension captures the full session context, turning vague "it broke" reports into structured Jira tickets with 90% faster triage. You can find more insights on the impact of JS error rates on business metrics.
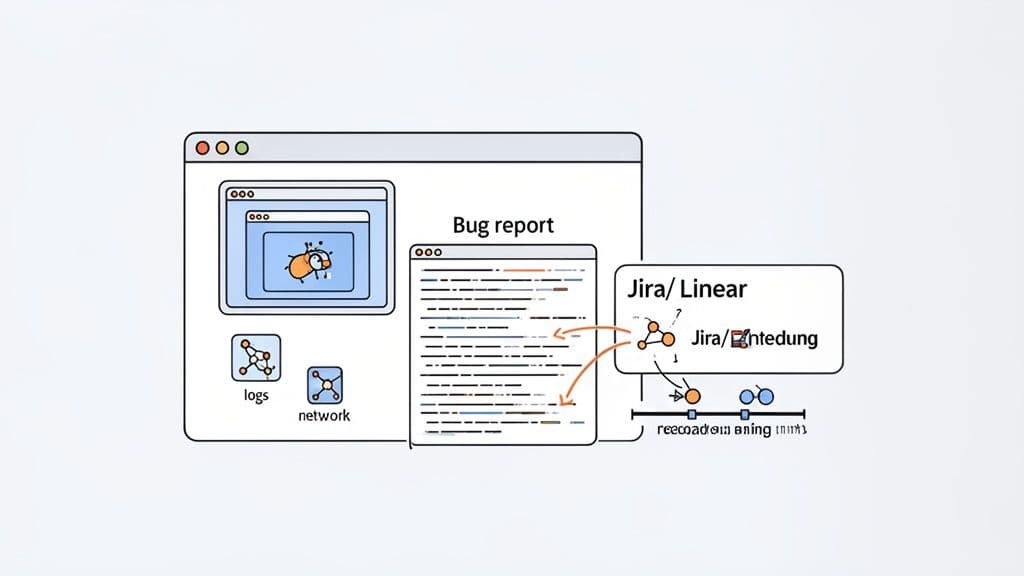
This integration is where the magic happens. Exporting these rich reports directly into project management tools like Jira or Linear eliminates all the manual work. No more copying and pasting, no more follow-up emails begging for more information.
The ticket that lands in your queue is ready to go. You can watch the session recording to see the bug happen, inspect the network logs to check API responses, and analyze the console output to find the exact line of code that failed. This immediate clarity means you can diagnose the root cause and ship a fix with confidence, collapsing a process that used to take days into a matter of hours.
Common Questions About JavaScript Error Handling
Once you start getting serious about handling JavaScript errors, a few key questions always pop up. It's totally normal. Figuring out the difference between handlers, worrying about performance, and making sure you're respecting user privacy are all part of building a solid system. Let's walk through the questions I hear most often from other developers.
What's the Difference Between window.onerror and a try...catch Block?
The easiest way to think about this is scope. A try...catch block is your surgical tool. You use it when you're working on a specific piece of code that you know is a little risky and might fail. Think of parsing some JSON you just received or performing a calculation that could go wrong—these are perfect spots for a try...catch.
On the other hand, window.onerror is the big safety net. It's a global event handler designed to catch any runtime errors that you didn't see coming and that slip past all your other defenses, bubbling all the way to the top.
My rule of thumb: Use
try...catchfor known failure points where you can actually do something to recover. Letwindow.onerrorbe your global backstop to log everything else you didn't anticipate. That way, nothing slips through the cracks.
How Do I Handle Errors in Asynchronous Code?
Ah, the classic async gotcha. This trips up so many developers because unhandled promise rejections are a huge source of silent bugs—they don't trigger window.onerror, so they can fail without you ever knowing.
If you're using traditional Promise chains, the fix is to always remember to tack a .catch() block onto the end. This one block will handle a rejection from anywhere in the preceding chain.
fetch('/api/data') .then(response => response.json()) .then(data => processData(data)) .catch(error => { // This catches errors from the fetch, the .json() call, or processData() console.error('Something went wrong fetching data:', error); });
With the more modern async/await syntax, things get even simpler. Just wrap your await calls in a good old-fashioned try...catch block, exactly like you would with synchronous code. This is definitely the way to go, as it gives you one clean, consistent way to handle both synchronous and asynchronous errors.
Do Source Maps Hurt My Application's Performance?
This is a great question, and the answer is a relieving no—but only if you do it right. A common mistake is shipping your source map files to your users' browsers along with your minified code. This is bad for two reasons: it adds unnecessary weight to your app, and it can expose your original source code, which isn't great for security.
The right way to handle it is a two-step process:
- Generate source maps as part of your production build.
- Upload those map files directly to your error monitoring service.
This way, the source maps never even touch the end-user's browser. When an error is thrown, the garbled stack trace is sent from the user to your monitoring tool. That tool then uses the source maps it has on file to de-obfuscate the stack trace, giving you a perfectly readable report. You get all the benefits with zero performance hit for your users.
How Can I Avoid Logging Sensitive User Data?
This isn't just a "nice-to-have"—it's an absolute must for user privacy and for staying compliant with regulations like GDPR and CCPA. You have to build a sanitization step into your error handling pipeline before any data leaves the user's browser.
The goal here is to scrub out any Personally Identifiable Information (PII). That includes things like:
- Usernames and full names
- Email addresses and phone numbers
- Passwords and session tokens
- API keys and auth headers
- Physical addresses or financial data
Thankfully, most modern error monitoring tools are built for this. They'll give you configuration options to redact specific keys, use regular expressions to match patterns, or block entire chunks of your application's state from being sent. Always be aggressive with data sanitization—it's about protecting your users and your company.
Stop wasting hours on vague bug reports. With Monito, you can turn messy reproduction steps into clear, developer-ready tickets in just one click. Capture session recordings, console logs, and network activity to fix issues faster.
Start debugging smarter with Monito
Powered by the Outrank tool