How to open har file and Transform Your Debugging Workflow
Learn how to open har file with Chrome DevTools or online viewers. This practical guide helps developers and QA analyze network logs and speed debugging.
How to open har file and Transform Your Debugging Workflow
Got a HAR file you need to inspect? The fastest way to get started is to just drag and drop the .har file right into the Network tab of your browser's Developer Tools. This little trick works perfectly in Chrome, Edge, and Firefox, giving you an instant breakdown of all the recorded web requests without messing with any external software.
What Is a HAR File and Why Is It So Important?
A HAR (HTTP Archive) file is essentially a JSON-formatted log that records every single network interaction between a web browser and a website. Think of it as your web session's "black box recorder"—it captures the entire conversation, from the initial request to the final byte of data.
This file is a linchpin for modern web debugging. It turns vague complaints like "the page is slow" or "this button doesn't work" into a story told with hard data.
Instead of playing a guessing game, developers, QA engineers, and support teams can use a HAR file to see the exact sequence of events. It shows you everything:
- Request and Response Headers: All the metadata sent to and from the server, including things like authentication tokens and content types.
- Performance Timings: A detailed waterfall breakdown showing precisely how long each phase of a request took—from DNS lookup to content download.
- Status Codes: A clear record of what succeeded (like a
200 OK) and what failed (like a404 Not Foundor500 Internal Server Error). - Payload Data: The actual content sent in POST requests or received in API responses, which is absolutely critical for debugging application logic.
The Power of Detailed Network Logs
Having this level of detail is a game-changer. When you're looking at a HAR file's waterfall chart, you can immediately spot a script that's blocking the page from rendering or an API call that’s taking way too long. It cuts through the noise and provides a single source of truth for what actually happened during a user's session.
The HTTP Archive format itself has become a universal standard since it was solidified under W3C guidance around 2009. With over 95% adoption by major browsers by 2015, its simple JSON structure holds a treasure trove of data. I’ve seen teams use this information to shave 25-40% off their page load times. If you’re curious about the nuts and bolts, you can explore the official specification to see just how comprehensive it is.
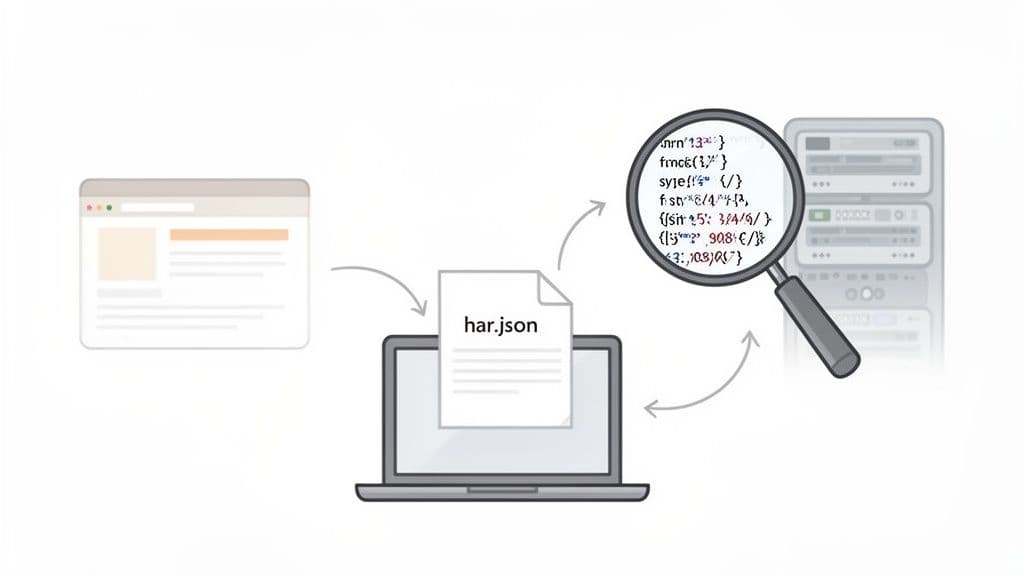
The image above gives you a sense of just how granular the data is, showing the full lifecycle of timings, headers, and content for every single resource the page loaded. It's this detail that makes a HAR file so incredibly useful for troubleshooting.
Opening HAR Files with Your Browser's Built-In Tools
You don't need to hunt for special software to get started. The most powerful tool for dissecting a HAR file is probably already open on your screen: your browser's own Developer Tools. Whether you're using Chrome, Firefox, or Edge, the built-in DevTools offer a fast, native, and surprisingly deep environment for digging into network logs. For most developers and QA folks, this is the quickest way to get answers without breaking your flow.
The easiest method? Just drag and drop your .har file right onto the Network tab in an open DevTools panel. Seriously, that's it. The browser instantly parses the file and fills the panel with all the recorded requests, just as if you'd been recording the session live. This is perfect for quick, on-the-fly diagnostics.
Navigating the Network Panel Interface
Once your HAR file is loaded, you'll be staring at the waterfall view. This chart is the heart and soul of network analysis, giving you a visual timeline of how and when every single resource loaded. Each row is a network request, and the bars stretching across the screen break down the timing for each one.
Here’s what I immediately look for when I open one up:
- Long Bars: These are your slowpokes. Hover over any long bar to see exactly where the time went—was it a slow DNS lookup, a long wait for the server to respond (Time to First Byte), or just a massive file download?
- Red Rows: Red means trouble. These are failed requests. A quick click on a red row will show you the HTTP status code (like a
404 Not Foundor500 Internal Server Error) in the Headers tab, pointing you straight to the problem. - Gaps in the Waterfall: Big empty spaces between requests are a red flag. This often points to render-blocking scripts or a dependency bottleneck where the browser is stuck waiting for one thing to finish before it can even ask for the next.
This is what a typical waterfall chart looks like right inside the DevTools Network panel.
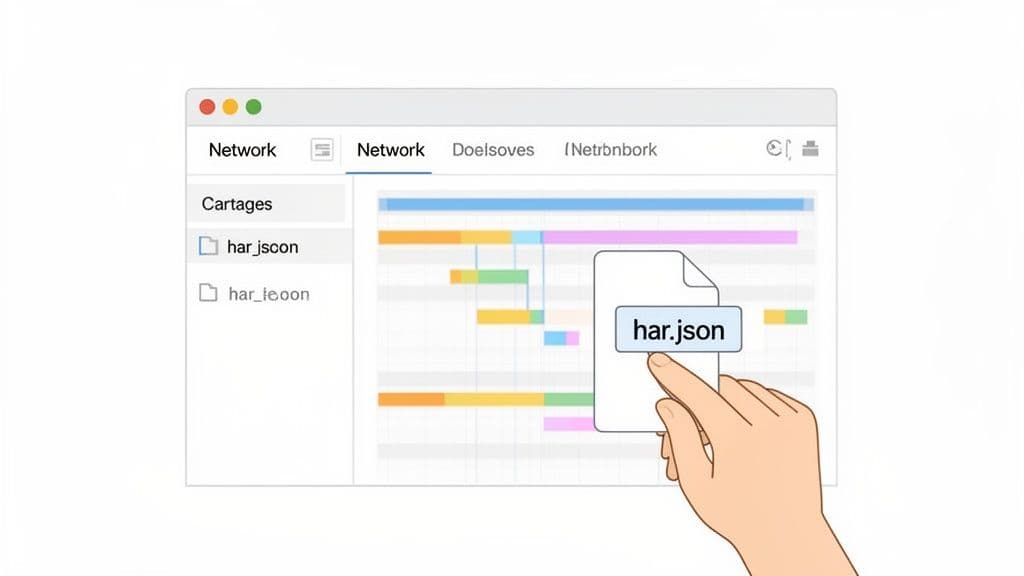
The image shows you the main areas you'll be working with: the request list on the left, the visual waterfall timeline, and the details pane where you can inspect everything from headers to response payloads.
Filtering and Inspecting Requests
A busy web app can generate a HAR file with hundreds, if not thousands, of requests. Finding the one that matters can feel like searching for a needle in a haystack. This is where the filter box becomes your best friend. You can filter by request type (like Fetch/XHR for API calls, JS, or CSS), by a specific domain, or even by a keyword in the URL.
For instance, if I'm debugging a broken API call to /api/v1/user/profile, I'll just type /user/profile into the filter. Instantly, the list shrinks to show only the relevant requests, letting me focus without all the noise.
Pro Tip: When you're stuck on an authentication bug, the Headers tab is where you want to be. I always check for the
Authorizationheader on the outgoing requests and look forSet-Cookieheaders in the server's response. A missing or mangled token is a classic bug that’s easy to spot here.
Once you’ve zeroed in on a request, you can click on it to dig even deeper:
- Headers: See the full request and response headers, exactly as they were sent.
- Payload/Preview: Check the data sent up to the server (the payload) and get a clean, formatted preview of the API's response. This is essential for verifying data.
- Timing: Get a super-detailed, millisecond-level breakdown of the entire request lifecycle.
If you're looking to really master this process, our guide on how to get a Chrome HAR file has even more advanced tips for both capturing and analyzing these network logs.
Using Online and Standalone HAR Viewers
While your browser's DevTools are fantastic for a quick look, sometimes you need more analytical firepower. Or maybe you just need a simpler way to share what you've found with your team. This is exactly where dedicated online and standalone HAR viewers come in—they offer a clean, focused interface and features that go beyond the basics.
These tools are a lifesaver for support agents who don't live in DevTools all day or for performance engineers doing a deep-dive analysis. Instead of being stuck in a browser tab, you get a workspace built for one thing: inspecting HAR files.
Exploring Popular Online HAR Analyzers
Online viewers are easily the fastest way to get a HAR file open and visualized. You just visit a website, drag and drop your .har file, and you get an instant, interactive breakdown of all the network requests.
A great first stop is Google's HAR Analyzer. It gives you a clean, user-friendly interface that feels a lot like the waterfall chart from Chrome DevTools, but in a simple, shareable web app.
Here’s what you see right after uploading a file.
It immediately gives you a high-level summary at the top before diving into the detailed request list and waterfall chart. This makes it incredibly easy to spot bottlenecks at a glance.
Another fantastic option is Jan Odvarko's online HAR viewer, a tool that’s well-known and respected in the developer community. The need for tools like this is huge. The annual HTTP Archive dataset processes over 30 million HAR exports every year and finds that 61% of desktop pages are slower than recommended. Tools like this are how we figure out why. If you want to dive deeper into the data, this technical blog post is a great read.
These online viewers are perfect for a few specific scenarios:
- Quick Sharing: Just send a link to a colleague to get a second pair of eyes on an issue.
- Accessibility: No need to install anything, which is great for less technical team members.
- Simple Visualization: They present the data cleanly, without all the other clutter from DevTools.
When to Use Offline Desktop Applications
Now, if you're dealing with sensitive data or absolutely massive files, an offline desktop app is the smarter, safer bet. Remember, when you upload a HAR file to an online service, you're sending potentially confidential information across the internet.
An offline viewer keeps all your data on your local machine. For many organizations, this is non-negotiable, especially when HAR files contain proprietary info, API keys, or personal user data.
Desktop tools also handle big files much better. A huge HAR file, maybe from a long user session with thousands of requests, can easily crash a browser tab. Standalone applications are built to manage these larger datasets without breaking a sweat.
Ultimately, they provide the security and stability you need for serious, in-depth analysis. This makes them the go-to for enterprise-level debugging and performance tuning, where data privacy and reliability are everything.
Turning HAR Data Into Actionable Bug Reports
A raw HAR file is a treasure trove of data, but on its own, it’s just the start. The real magic happens when you transform that ocean of network requests into a crystal-clear, actionable bug report that a developer can actually use. A great report doesn't just point out a problem; it guides the developer straight to the solution.
This means we have to do better than just attaching a .har file to a ticket with a note like "the page is slow." The mission is to find the exact network request that’s causing the trouble and wrap it in all the context a developer needs to squash the bug.
Pinpointing the Problematic Request
When you first open a HAR file, it's easy to get overwhelmed by the sheer number of entries. Your first job is to hunt down the specific request that either failed or is dragging everything down. I always start by looking for the most obvious clues:
- HTTP Error Codes: Scan the list for any status codes in the
4xxrange (like a404 Not Foundor403 Forbidden) or the5xxrange (like a500 Internal Server Error). These are dead giveaways that something is broken. - Excessive Timings: In the waterfall view, look for requests with unusually long bars. A high "Time to First Byte" (TTFB) is often a red flag for a sluggish backend process or a slow API endpoint.
- Incorrect Payloads: For API calls (you'll see these as XHR/Fetch requests), you need to dig into the response body. Did it return the data you expected, or did you get an empty array, an HTML error page, or some garbled JSON?
Once you’ve found a suspicious request, you'll often want to test it in isolation. Tools like Postman or Insomnia are perfect for this. They are powerful API clients for testing that let you manually resend the request and poke at the server's response in a controlled environment.
This flowchart gives you a quick way to decide which tool is best for digging into your HAR file.
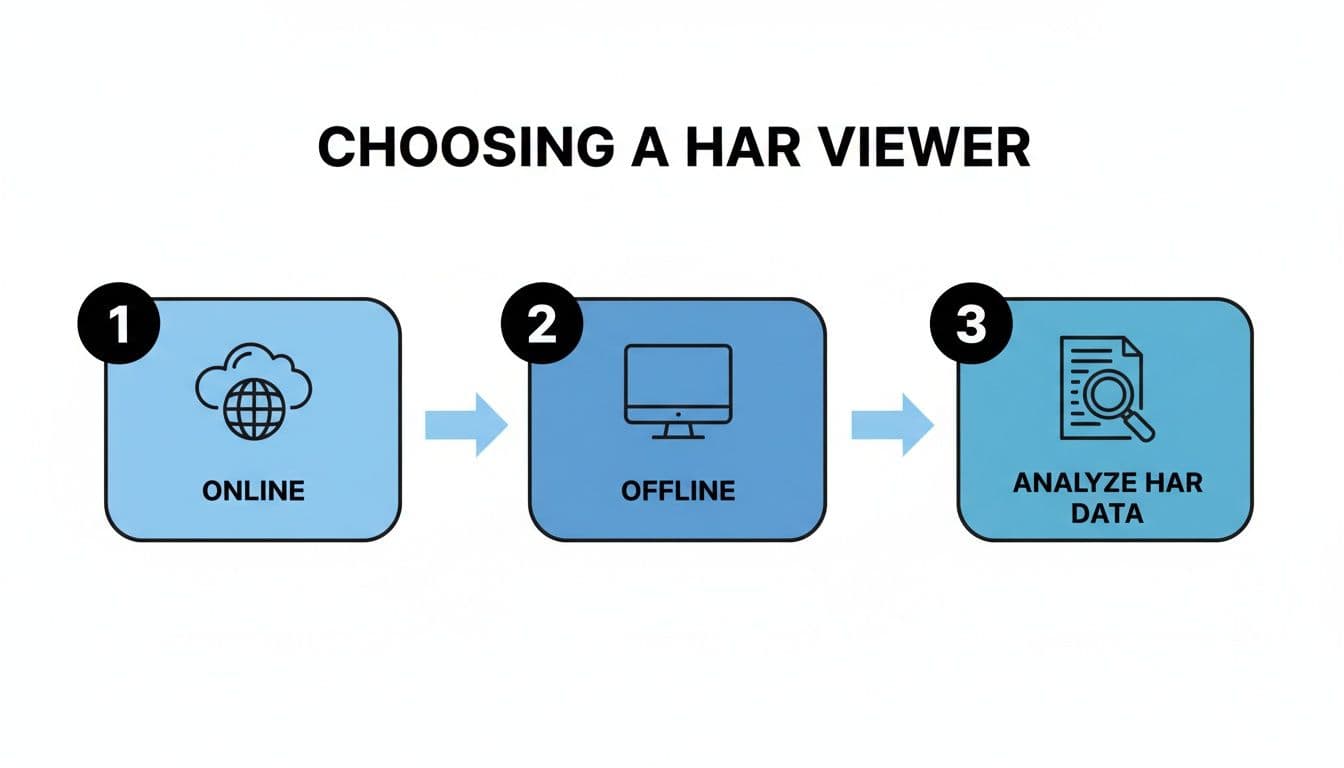
As you can see, online viewers are great for quick, collaborative checks, but if you're dealing with sensitive data or a massive file, an offline tool is the way to go for better security and performance.
Building a Complete Bug Report
A single failed request is a solid clue, but it's rarely the whole story. The best bug reports tell a complete narrative, leaving no room for guesswork. This is where combining your HAR data with other session context becomes a total game-changer.
A HAR file tells you what went wrong on the network. But console logs, user steps, and a session replay tell you why it happened from the application's side. Put them together, and you have the fastest path to a fix.
Your goal is to bundle everything a developer needs to replicate the bug without having to ask you a dozen follow-up questions. For a masterclass in what this looks like, check out this excellent bug report template that covers all the key ingredients.
Here’s what a developer-ready report should always include:
- A Clear Summary: Just one sentence describing the bug (e.g., "Updating user profile fails with a 500 error on save.").
- Reproduction Steps: A numbered list of the exact actions a user took to trigger the bug.
- The HAR File: The full network log for deep-dive analysis.
- Console Logs: Any JavaScript errors or warnings that fired during the session.
- Session Replay: A screen recording or session replay video is worth a thousand words. It visually shows the issue as it happened.
Putting all of this together manually can be a real grind. The table below illustrates just how much time and effort this can take compared to using a dedicated tool.
Manual vs. Automated Bug Reporting with HAR Files
| Task | Manual Process (Time & Effort) | Automated with a Tool (Time & Effort) |
|---|---|---|
| Capture HAR File | Open DevTools, start recording, reproduce the bug, stop recording, export the file. (High) | Runs automatically in the background. (Zero) |
| Get Console Logs | Switch to the Console tab, copy-paste logs, hope you got everything. (Medium) | Captured automatically alongside the HAR file. (Zero) |
| Document User Steps | Manually write down every click and keystroke from memory. Prone to error. (High) | User actions are tracked and listed automatically. (Low) |
| Record Screen | Start a separate screen recorder, reproduce the bug, stop, save, and upload the video. (High) | A session replay video is generated automatically. (Zero) |
| Create Ticket | Combine all assets into a ticket, format it, and link everything manually. (High) | Creates a perfectly formatted ticket with all context included in one click. (Low) |
This is precisely where integrated debugging tools like Monito come in. They automatically capture the HAR file, console logs, user actions, and a screen recording all at once. It’s all packaged into a perfectly structured ticket that can be sent straight to Jira or Linear with a single click. This automated approach ensures nothing gets missed and slashes the time it takes to get from bug discovery to a finished fix.
Common Pitfalls When Handling HAR Files
Working with HAR files can be incredibly revealing, but it's not always a walk in the park. You can run into a few common traps that will either crash your browser or, even worse, expose sensitive data. Knowing what to look out for ahead of time will save you from some serious headaches.
The most common issue I see is simply file size. A long user session or a chatty single-page application can easily generate a HAR file that’s hundreds of megabytes. If you try to drag and drop a massive file like that directly into your browser’s DevTools, you're practically asking for a frozen tab or a full-on crash. Browsers just aren't built to visualize that much network data all at once.
The Security Blind Spot: Redacting Sensitive Data
Far more dangerous than a browser crash is the risk of leaking sensitive information. A HAR file is a literal transcript of everything the browser and server said to each other, and that conversation often includes things you wouldn't want to become public. This isn't just a theoretical problem—it's a real-world risk.
Warning: A HAR file can easily contain session cookies, authentication tokens in headers, API keys, and personally identifiable information (PII) within POST request payloads. Sharing a raw HAR file is a major security blunder.
Before you ever share a HAR file, you have to treat it like a sensitive document. The process of stripping out this confidential data is called redaction or sanitization. While some browser tools have an option for this, they're not foolproof and often miss custom headers or specific payload data. It’s always on you to double-check.
You could use a text editor's find-and-replace feature, but that’s a risky game—it's incredibly easy to miss something. A much safer bet is to use command-line scripts or dedicated tools that have built-in redaction features.
Best Practices for a Smoother Workflow
To sidestep these common issues, it's best to build good habits from the get-go. Being proactive is always better than cleaning up a mess later, which is a good principle whether you're debugging network requests or handling JavaScript errors in your code.
Here are a few practical tips to keep your workflow smooth and secure:
- Filter Before You Record: Before you even hit the record button in DevTools, use the filter bar to zero in on what you actually need. If you're chasing an API bug, filter by
Fetch/XHRto cut out all the noise from images and scripts. - Record in Short Bursts: Don't record a 10-minute user journey. Instead, start the recording right before the user action that triggers the bug, then stop it immediately after. This keeps file sizes tiny and manageable.
- Use Offline Viewers for Large Files: If you get stuck with a massive HAR file, don’t force it on your browser. Use a standalone desktop application designed to handle large datasets without breaking a sweat.
- Establish a Redaction Policy: Your team needs a clear, documented process for scrubbing HAR files. Make sure everyone knows what to look for and how to remove all sensitive data before a file is ever shared.
A Few Lingering HAR File Questions
Once you get the hang of generating and inspecting HAR files, a few common questions almost always come up. Let's tackle them head-on so you can avoid common pitfalls and get the most out of your network data.
Can I Just Open a HAR File in a Text Editor?
You sure can. At the end of the day, a HAR file is just a big chunk of JSON saved with a .har extension. You can pop it open in VS Code, Sublime Text, or even a basic text editor to see the raw data.
Honestly, this is my go-to move for a few quick tasks. A simple text search (Ctrl+F or Cmd+F) is the fastest way to hunt down a specific URL, a rogue header, or a particular error message. It's also a brute-force method for finding and deleting sensitive data before you share a file.
But for anything more, you’ll hit a wall. Trying to make sense of network waterfalls or request timings by staring at raw JSON is a recipe for a headache. For actual analysis, a proper viewer is non-negotiable.
How Do I Scrub Sensitive Data Before Sharing a HAR File?
This is probably the single most important question to ask. Before a HAR file ever leaves your machine, you have to treat it like a security risk and scrub it clean.
Think about it: these files can contain Authorization tokens, API keys, session cookies, and personal information tucked away inside request payloads.
Warning: A raw HAR file is a security snapshot of your session. Sharing it without redaction can expose user accounts, leak API keys, and give away proprietary info. Always, always treat these files as confidential.
You could use find-and-replace in a text editor, but it’s incredibly easy to miss something. A much safer bet is to use a dedicated HAR sanitization script or tool. The best-case scenario, especially when working in a team, is to use a bug reporting tool that captures this data automatically and provides secure, role-based access. This way, you prevent the accidental leak from happening in the first place.
What's the Difference Between a HAR File and Console Logs?
Great question. They're two sides of the same debugging coin, each telling a different part of the story.
- A HAR file is all about network traffic. It’s the complete record of the conversation between the browser and the server. It shows every request, response, timing, header, and status code. This is the network story.
- Console logs are the browser's diary. They capture JavaScript errors, warnings, and any custom messages your application's code spits out. This is the client-side application story.
To solve a bug, you almost always need both. The HAR file might show you a nasty 500 Internal Server Error from an API endpoint, but the console log will show the exact JavaScript exception that blew up when your app tried (and failed) to process that bad response. One without the other is just half the picture.
Tired of piecing together bug reports? Monito captures HAR files, console logs, user actions, and session replays automatically, then bundles it all into a perfect, developer-ready ticket in one click. See how much time you could save.