A Developer's Guide to the Chrome HAR File
Unlock the power of the Chrome HAR file. Our guide shows you how to generate, analyze, and use HAR files to debug network issues and boost web performance.
A Developer's Guide to the Chrome HAR File
Ever find yourself staring at a bug report that just says "the site is slow" or "this button doesn't work"? That kind of feedback is frustratingly vague. This is where a Chrome HAR file becomes your best friend.
Think of it as a flight recorder for your web browser. It's a JSON-formatted archive that logs every single network request a browser makes while loading a page—from the initial HTML document to the last tracking pixel. It's a complete, millisecond-by-millisecond recording of the conversation between the browser and the server.
What Is a Chrome HAR File and Why Does It Matter
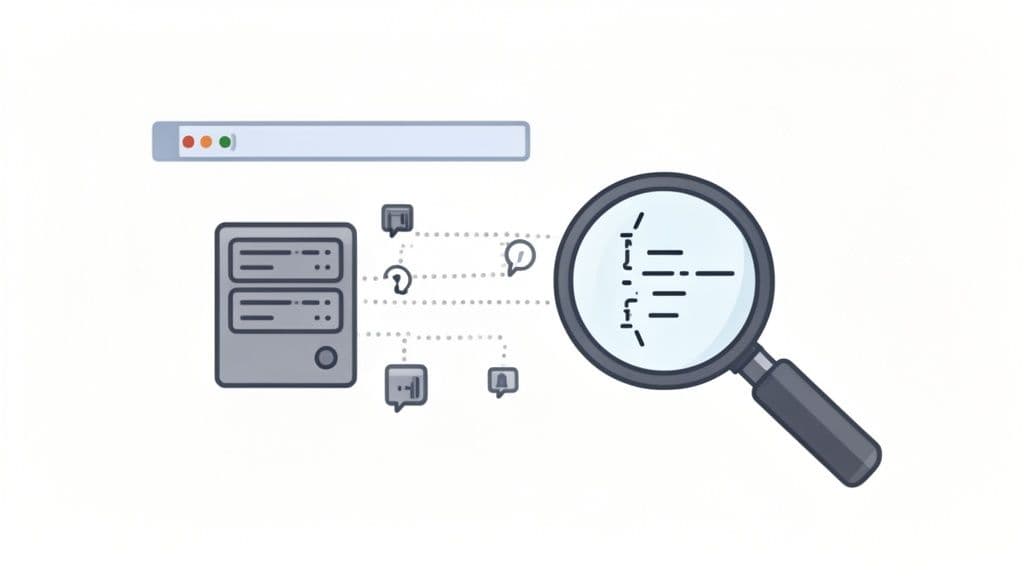
The HAR (which stands for HTTP Archive) file turns those ambiguous user complaints into concrete, actionable data. It provides a precise timeline of a page's loading process, making it an indispensable tool for developers, QA engineers, and customer support teams alike.
This isn't just a simple log; it’s a deep diagnostic report. Hidden within its data is the root cause of countless common web problems.
The Power of Detailed Network Logs
By digging into a Chrome HAR file, you can pinpoint performance bottlenecks and elusive errors that are otherwise invisible. You stop guessing and start diagnosing with evidence.
This is exactly why HAR files are so critical in modern web development. They give you clear answers to tough questions:
- Which images are slowing us down? A HAR file shows the exact size and load time for every asset, making oversized images stick out like a sore thumb.
- Is an API call failing? You can inspect the full request and response, including status codes like a
404 Not Foundor a500 Internal Server Error. - What's blocking the page from rendering? The waterfall view visualizes how resources load over time, instantly revealing scripts that hold up everything else.
- Are we making redundant network requests? Sometimes a page might hit the same endpoint multiple times unnecessarily—a classic inefficiency that’s easy to spot in a HAR log.
A HAR file transforms debugging from a painful process of elimination into a direct investigation. It provides the full story behind a network-related bug, dramatically cutting down the time it takes to find and fix the problem.
Given Chrome's massive footprint in the browser market—holding a 64.86% global market share—it's the primary environment where these issues are reported and diagnosed. With over 3.45 billion users projected by 2026 (a 44.35% jump since 2018), the ability to generate HAR files from Chrome's DevTools is a core skill for any web professional. These detailed logs are the standard for capturing every request, response, and asset transfer. You can find more details on Chrome's user statistics at cropink.com.
A HAR file is packed with valuable information. The table below breaks down some of the most important data points and what they can tell you.
| Key Information Captured in a HAR File |
| :--- | :--- | :--- |
| Data Point | What It Tells You | Example Use Case |
| Request & Response Headers | Shows cookies, caching policies, server details, and content types. | Debugging authentication issues by checking for a missing Authorization header. |
| Timings Breakdown | Breaks down each request into phases like DNS lookup, connecting, waiting (TTFB), and content download. | Identifying a slow server response by looking for a long "waiting" (Time to First Byte) duration. |
| HTTP Status Codes | Reveals the outcome of each request (e.g., 200 OK, 404 Not Found, 503 Service Unavailable). | Finding broken links or failing API endpoints that return 404 or 5xx errors. |
| Asset Size & Type | Details the size of every downloaded file (images, scripts, CSS) and its MIME type. | Pinpointing large, unoptimized images that are causing slow page loads. |
| Waterfall Chart Data | Provides a visual timeline of when each request started and finished, showing dependencies. | Spotting a render-blocking JavaScript file that prevents the rest of the page from loading. |
Understanding these components allows you to quickly move from identifying a problem to understanding why it's happening, which is the key to an effective fix.
Getting Your First Chrome HAR File
Alright, let's roll up our sleeves and create your first Chrome HAR file. The process itself is pretty simple, but knowing why you're clicking each button is what turns a useless log into a diagnostic powerhouse. Our goal here is to capture a clean, precise record of the network activity you need to investigate.
To really get this right, you need to understand how to capture HTTP requests from your browser. Think of Chrome DevTools as your personal recording studio; the Network tab is the microphone, and it picks up every single conversation happening between your browser and the web servers.
Setting Up the DevTools Network Panel
Before you even hit the record button, you need to set the stage. Pop open Chrome DevTools by right-clicking anywhere on the page and choosing Inspect. You can also use the keyboard shortcut: Ctrl+Shift+I on Windows/Linux or Cmd+Option+I on a Mac. Once it’s open, navigate to the Network tab.
At the top of this panel, you’ll spot a few checkboxes. Two of them are absolutely essential for generating a useful HAR file:
-
Preserve log: This little lifesaver stops the Network log from wiping itself clean every time you navigate to a new page or the site reloads. It's crucial for tracking down bugs that span multiple pages, like a wonky login process that bounces you between a few different URLs. If you leave this unchecked, you’ll only capture the activity for the very last page you landed on.
-
Disable cache: Ticking this box forces Chrome to ignore any files it has stored locally in its cache. This makes the browser request every single asset directly from the server, just like a first-time visitor would experience it. This gives you an unfiltered view of your site's true loading performance.
Getting these settings right from the start ensures your recording is both complete and accurate, capturing the entire user journey without cached files muddying the waters.
Recording and Exporting the Log
With your settings dialed in, you're ready to record. First, check the circular record button in the top-left corner of the Network panel. If it's red, you're live. If it's gray, just click it to start recording. I always make it a habit to click the "Clear" icon (the little circle with a line through it) to wipe out any previous network chatter before I begin.
Now, go ahead and replicate the exact actions that are causing the problem. If a button isn't working, for example, you would reload the page, ensure recording is active, and then click that specific button. As soon as you've reproduced the issue, you can stop the recording.
My Go-To Tip: For the cleanest possible log, I always do a "hard refresh" (
Ctrl+Shift+RorCmd+Shift+R) after opening the Network tab but before I start reproducing the bug. This forces the browser to re-download everything from scratch, making sure you aren't looking at stale data.
To save your recording, just right-click anywhere within the list of network requests and select Save all as HAR with Content. This is key—it exports a complete log that includes the actual content and response bodies from the server, which is often where the clues are hidden.
HAR files are my secret weapon for hunting down performance bottlenecks. They show you everything, right down to precise timings for things like DNS resolution, which can spike on a bad connection—a detail you can see right in the HAR. Saving the file with full content gives you the best possible shot at finding the root cause of whatever issue you're tackling.
How to Read a HAR File and Find Bottlenecks
So, you’ve generated a Chrome HAR file. Now for the fun part: putting on your detective hat and figuring out what’s actually going on. A raw HAR file is just a massive wall of JSON text, which can be pretty intimidating at first glance. But you don't need to be a network wizard to pull actionable insights from it.
The easiest entry point is an online HAR viewer. Forget trying to read the raw JSON; just drag and drop your .har file into a tool like Google's own HAR Analyzer. These viewers instantly transform that mess of data into an interactive waterfall chart, which is where the real analysis begins.
This visual flow is the key to capturing the network activity you'll be digging into.
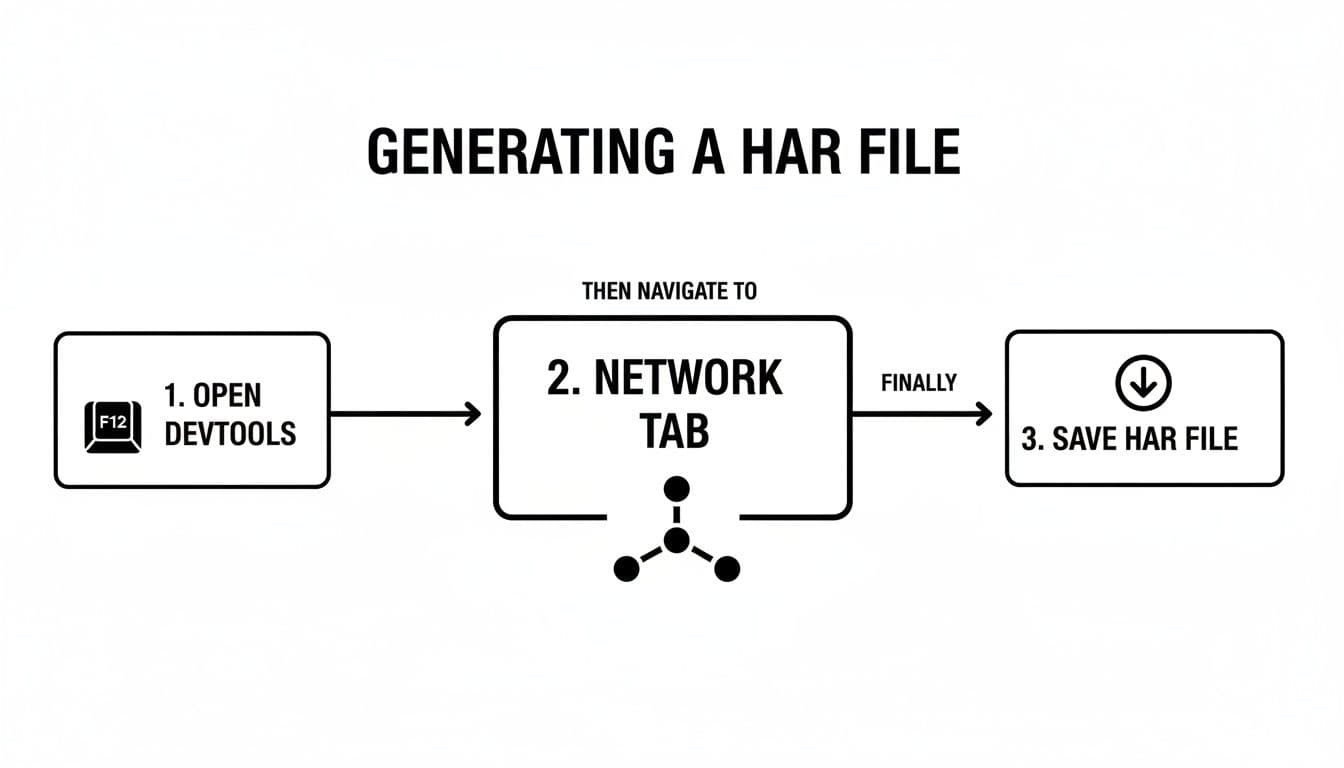
From opening DevTools to recording and saving the log, this simple process is all it takes to get the raw data you need for a deep-dive performance audit.
Decoding the Waterfall Chart
Think of the waterfall chart as your primary diagnostic tool. Each horizontal bar you see is a single network request for an asset—an image, a script, an API call, you name it. The length of the bar directly corresponds to how long that request took, from the initial connection all the way to the final byte received.
Scanning this chart is all about spotting the outliers. Look for:
- Long Bars: These are the low-hanging fruit. Any request taking multiple seconds is an immediate red flag and a prime candidate for investigation.
- Gaps or White Space: Big empty spaces between bars often mean the browser is stuck processing a heavy script before it can even think about fetching the next resources. This is a classic sign of a CPU bottleneck on the main thread.
- A Long First Bar: If that very first request for the main HTML document is dragging on, you're likely looking at a slow server response time, often called Time to First Byte (TTFB).
Identifying Common Performance Killers
Once you know what to look for, you can start hunting for specific, common problems that plague web applications.
A huge one is render-blocking resources. In the waterfall, these show up as long-running CSS or JavaScript requests near the very top of the chart, effectively halting the page from displaying anything until they're done. They hold everything else hostage.
Unoptimized images are another classic culprit. A quick trick is to sort the requests in the Network panel by size. You'll often find a massive 2MB hero image that’s completely torpedoing the user’s first impression. It happens more than you'd think.
A pro tip is to use the filter box to isolate specific problems. If you think a third-party script is the issue, filter by its domain. This cuts through the noise and shows you exactly how that service's requests are behaving.
Going Deeper
As you get more comfortable, you can start connecting the dots. For developers who live and breathe this stuff, exploring the best Chrome extensions for developers can reveal tools that integrate directly into this workflow, making analysis even faster.
And remember, network problems and application errors are often two sides of the same coin. A failed API call in your HAR file could be the direct cause of a cryptic error you're seeing in the console. For more on that, our guide on https://monito.dev/blog/handling-javascript-errors can help you connect what’s happening on the network to what your code is actually doing.
Sharing HAR Files Without Leaking Sensitive Data
A Chrome HAR file can be a developer's best friend for debugging, but it's also a potential security nightmare. Sharing one without taking the right precautions is like handing over the keys to your digital life. These files log everything, and "everything" often includes sensitive information you’d never want to expose.
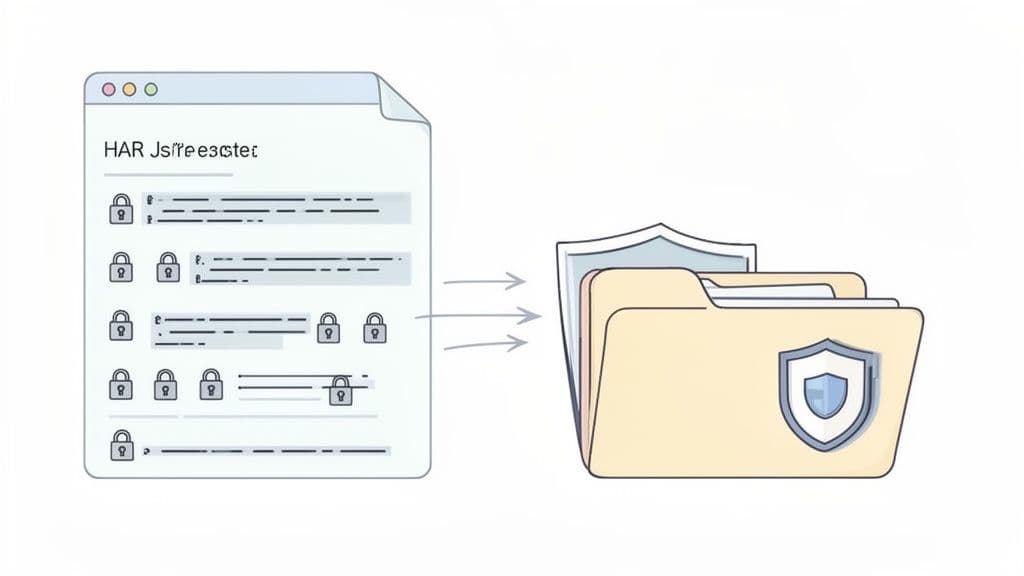
Before you ever attach a HAR file to an email or a bug report, it's critical to understand what's actually inside. It’s not just a simple list of URLs. It contains the full, unabridged details of every network request and response, which can be a goldmine for anyone with malicious intent.
What Sensitive Data Is Hiding in Your HAR?
Think about what happens when you log into a site, fill out a form, or buy something online. Every piece of that data gets sent across the network, and a HAR file captures it all, often in plain text.
Here's a quick look at the kind of high-risk data that almost always ends up in these files:
- Session Cookies and Tokens: These are your digital passport for a website. If someone gets their hands on your active session cookie, they can often bypass login screens and impersonate you, gaining full access to your account.
- API Keys: Many modern web apps embed API keys right into their network requests to talk to other services. If you accidentally leak one, an attacker could abuse that service on your behalf, potentially stealing data or running up huge bills.
- Personal Information: Any data you type into a form—passwords, email addresses, credit card details, home addresses—can be captured in a request's payload.
Treat every HAR file as if it contains your most sensitive passwords. Adopting this mindset is the single most important step you can take to prevent an accidental—and potentially catastrophic—data leak. Always, always sanitize before you share.
How to Safely Sanitize a HAR File
"Sanitizing" a HAR file just means finding and removing all the confidential data before it ever leaves your computer. You can do this manually, which is a bit tedious, or use tools that make the process much safer and faster.
Manual Redaction with a Text Editor
For the hands-on approach, you can pop open the .har file in any plain text editor like VS Code, Sublime Text, or even Notepad. It's just a big JSON file, so you can use the find-and-replace feature to hunt down sensitive text.
I usually search for keywords like:
AuthorizationCookiepasswordtokenapiKey
Once you find a sensitive value, either delete it entirely or replace it with a generic placeholder like [REDACTED]. This method gives you total control, but it's easy to miss something, which is a big risk. A properly sanitized HAR is a cornerstone of a great bug report; you can dive deeper into this in our guide on writing effective bug reports.
Using Automated Sanitization Tools
Honestly, a much safer and more efficient way to handle this is with a dedicated tool. There are plenty of open-source and online tools designed specifically to scrub HAR files. They're built to automatically recognize common patterns for keys, tokens, and other confidential data, removing them with far greater accuracy than a manual review. This approach seriously minimizes your risk and saves a ton of time, letting you focus on getting the bug fixed securely.
Taking HAR Generation Beyond the Manual Process
Knowing how to manually grab a chrome har file is a great skill to have in your back pocket, but let's be honest—it doesn't scale when you're working on a team. The classic bug reporting workflow is often a painful cycle of back-and-forth communication that just drains time and energy. A user reports an issue, a developer asks for more information, the user struggles to recall the exact steps, and the whole process stalls.
This communication gap is the real productivity killer. A bug ticket that just says "the checkout button is broken" is a dead end without more context. This is what leads to that infamous, soul-crushing developer response: "cannot reproduce."
The Problem with Vague Bug Reports
When an incomplete bug report hits a developer's queue, it’s like being handed a puzzle with half the pieces missing. The dev is immediately stuck with a bunch of questions that stop them from even starting to work on a fix.
- What exactly did the user do right before the error popped up?
- What was going on in the browser console at that exact moment?
- Did any network requests fail just before the bug occurred?
Expecting a non-technical user to remember and accurately report all this information is unrealistic. So, developers are forced to waste precious hours trying to guess the user's steps and recreate the specific conditions—a frustrating process that rarely works on the first try. Every minute spent on that guesswork is a minute not spent shipping a solution.
Building a Single Source of Truth
This is where embedding HAR files into your bug reports completely changes the dynamic. You stop relying on spotty human memory and instead create an objective, undeniable record of what happened. A HAR file is a precise, millisecond-by-millisecond log of every single network request, leaving no room for interpretation.
When you attach a HAR file to a bug report, you replace vague descriptions with hard data. The conversation shifts from "Can you tell me what you did?" to "Here is exactly what happened," giving developers the evidence they need to find the root cause right away.
This simple change practically eliminates the endless follow-up emails and makes the "cannot reproduce" issue a thing of the past. You're giving your team a complete, forensic-level account of all network activity at the very moment the bug appeared.
Automating the Debugging Workflow
Modern debugging tools can automate this entire capture process, making it seamless for everyone involved. Imagine a user hits a bug. Instead of asking them to open DevTools and try to make it happen again, they can use a tool like Monito.
With just one click, it automatically captures a complete diagnostic package in the background:
- The full HAR file with every network request and response.
- A screen recording of the user's exact actions.
- Complete console logs to catch any lurking JavaScript errors.
- User interaction data like clicks, scrolls, and navigation.
This bundle gives developers a rich, contextual report with everything they need in one neat package. It turns a clunky, manual task into a smooth, efficient workflow. This saves a massive amount of time for everyone—from support and QA to the engineering team—so you can all spend more time building great features and less time hunting down ghosts. If you're looking for more browser diagnostic tips, check out our guide on the Safari browser console.
Answering Your Top Questions About HAR Files
Even for seasoned developers, HAR files can bring up some tricky questions. Let's tackle a few of the most common ones I hear, so you can sidestep the usual hang-ups and get straight to the good stuff—squashing bugs.
Getting these details right will make your debugging sessions way more productive.
HAR Files vs. Console Logs: What's the Difference?
This is a classic point of confusion, but the distinction is actually pretty straightforward. Think of it this way:
A HAR file is your network detective. It captures every single conversation your browser has with a server. You'll see every request, every response, complete with timings, headers, and the data that was sent back and forth. It answers the question, "What happened on the network?"
Console logs, on the other hand, are the diary of your application's JavaScript. They show you errors, warnings, and any custom messages your code is programmed to output. The console answers, "What did the application's code do while it was running?"
The real magic happens when you use them together. A failing API call in your HAR file is often the smoking gun for a cryptic JavaScript error you see in the console. This is why tools that capture both simultaneously are so powerful—they give you the full story behind the bug.
Can I Generate a HAR File on a Mobile Device?
Absolutely, but you can't just pop open DevTools on your phone. It takes a little bit of setup.
- For Chrome on Android: The go-to method is Remote Debugging. You’ll connect your Android phone to your computer with a USB cable, which lets you use your desktop Chrome DevTools to inspect and record everything happening in the mobile browser.
- For iOS (Safari or Chrome): This one's a bit more involved. The most reliable approach is to use a proxy tool like Charles Proxy or Fiddler. These tools act as a middleman, sitting between your iPhone and the internet to intercept all the traffic. From there, you can export the session as a HAR file.
Why Is My HAR File So Huge?
If you've ever ended up with a HAR file that's hundreds of megabytes, you're not alone. This almost always happens because the recording includes the full content of every single asset.
When you export, choosing the option to include content embeds the entire response body for images, videos, and scripts directly into the file. For a media-heavy site, that adds up fast.
The best way to keep the file size manageable is to be surgical. Start recording right before you reproduce the issue, and stop it the second you're done. This cuts out all the background noise and keeps the log tightly focused on the problem you're trying to solve.
At Monito, we take the guesswork out of bug reporting. Our tool automatically captures the HAR file, console logs, and a screen recording all at once. This gives your developers a complete, actionable bug report in a single click, saving countless hours of back-and-forth. Get started with Monito for free.