A Modern Guide on How to Measure Developer Productivity
Learn how to measure developer productivity effectively with modern metrics like DORA, while avoiding common pitfalls that harm team morale and performance.
A Modern Guide on How to Measure Developer Productivity
Measuring developer productivity isn't about counting lines of code or tracking individual output. It's about looking at the entire development system and figuring out what's getting in the way. The best way to do this is by blending hard numbers, like deployment frequency, with real feedback from your team to spot and clear out the bottlenecks. This is how you help teams ship value faster without burning them out.
Rethinking What Developer Productivity Actually Means
For years, trying to measure developer productivity has been a real point of friction. Managers want to see how the team is doing, but engineers are understandably wary of being judged by metrics that don't tell the whole story of their complex work. This tension often leads companies to grab onto harmful, easy-to-game metrics that end up causing more problems than they solve.
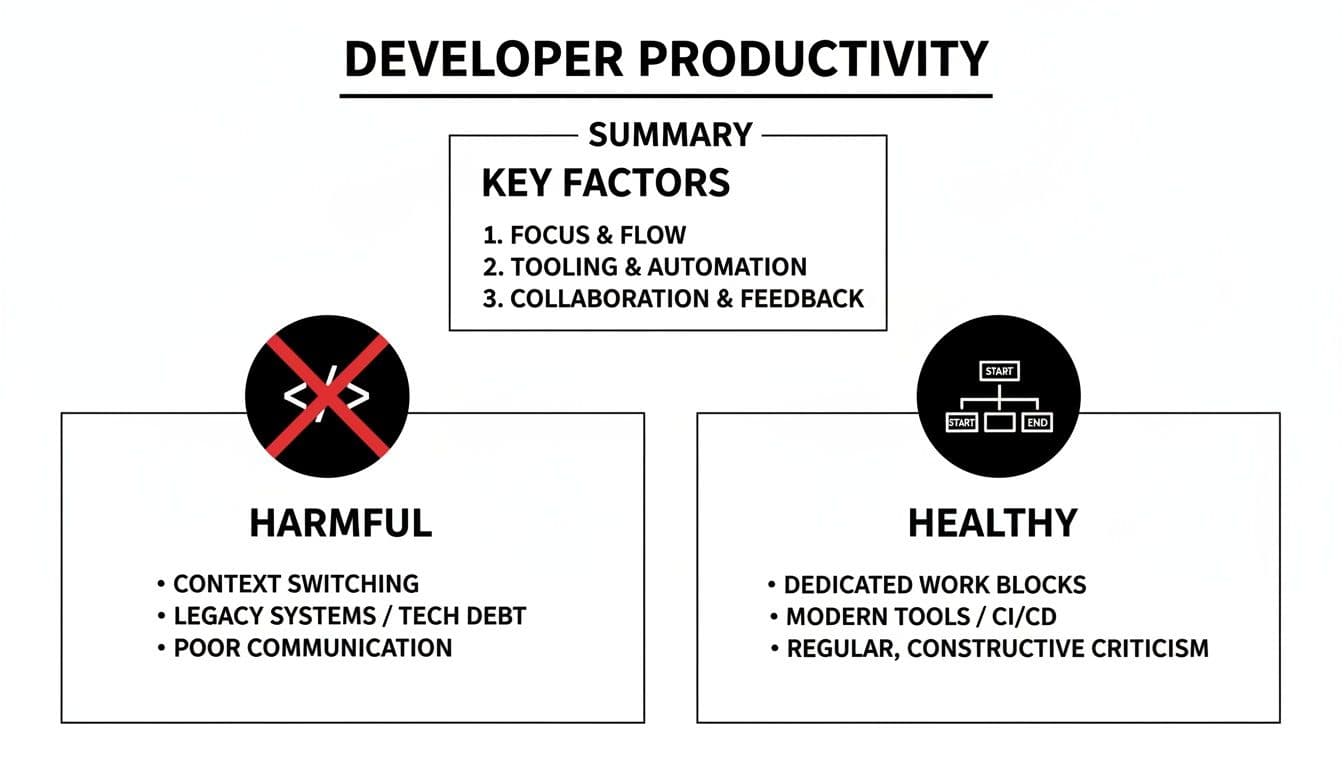
The right way to think about this requires a complete shift in perspective. Instead of asking, "How fast is this person coding?" we should be asking, "What's slowing our team down?" The goal isn't to put individuals under a microscope; it's to improve the whole system. A truly productive environment has as little friction as possible, letting developers get into that deep work state and ship great software without fighting unnecessary battles. To really get it, you have to understand the core ideas behind improving developer productivity by focusing on workflow optimization and removing obstacles.
Moving Beyond Flawed Metrics
Let's be honest: traditional metrics like lines of code, number of commits, or even story points are terrible proxies for productivity. They encourage all the wrong behaviors, like writing bloated, inefficient code just to hit a number or slicing tasks so thin they become meaningless. This creates a culture where people are competing instead of collaborating.
The most effective way to think about developer productivity is not as a measure of individual output, but as a diagnostic tool for system health. When your metrics show a problem, the first question should always be 'What in our process is causing this?' not 'Who is responsible?'
The following table really drives home the difference between the old, counterproductive ways of measuring and the modern, system-focused approach.
Moving From Harmful Metrics to Healthy Indicators
| Outdated (Harmful) Metric | Modern (Healthy) Indicator | Why It's a Better Measure |
|---|---|---|
| Lines of Code (LoC) | Change Lead Time | Measures the entire process from commit to production, revealing systemic bottlenecks. LoC rewards quantity over quality. |
| Number of Commits | Deployment Frequency | Shows how often the team successfully ships value to users. Frequent, small deployments are a sign of a healthy, agile system. |
| Story Points Completed | Mean Time to Recovery (MTTR) | Focuses on resilience. How quickly can the team fix a problem in production? This reflects system stability and responsiveness. |
| Individual Velocity | Developer Satisfaction | A direct signal of friction, burnout, and toolchain issues. A happy, unblocked team is a productive team. |
Ultimately, the goal is to use data to understand the health of your entire engineering ecosystem, not to rank individual developers.
As you can see, the focus has moved from simple, misleading output counts to a more holistic view of flow, stability, and team well-being.
A Focus on Systems, Not People
A healthy measurement framework looks at the entire software delivery lifecycle, from idea to production. It combines quantitative data from well-regarded frameworks like DORA with qualitative insights that can only come from talking to your developers. This balanced approach tells you the real story behind the numbers.
For example:
- Are lead times getting longer? This could point to a clunky code review process or a flaky testing environment that everyone's trying to work around.
- Seeing a spike in change failure rates? That might be a sign of mounting technical debt or a lack of robust automated testing.
- Is developer satisfaction dipping? This is a massive red flag. It means your team is frustrated, blocked, or headed for burnout.
When you see measurement this way, it stops being a top-down mandate and becomes a collaborative tool for getting better. The data starts the conversation, empowering teams to find their own bottlenecks and experiment with solutions. This builds trust and creates a culture where everyone is invested in making things work better.
Choosing Engineering Metrics That Actually Matter
The real trick to measuring developer productivity without tanking team morale is to pick a set of metrics that tells a story about your systems, not just your people. It's about shifting the focus away from individual output and looking instead at team-level indicators of health and velocity. You need a mix of hard numbers and human experience to get the full picture.
A fantastic starting point for the quantitative side is the set of DORA metrics. They've become something of an industry benchmark for a reason—they measure the efficiency and stability of your entire software delivery process, not just one piece of it. Many teams even start by exploring specialized time tracking software for developers to get the raw data they need to calculate these figures.
The Four Pillars of DORA Metrics
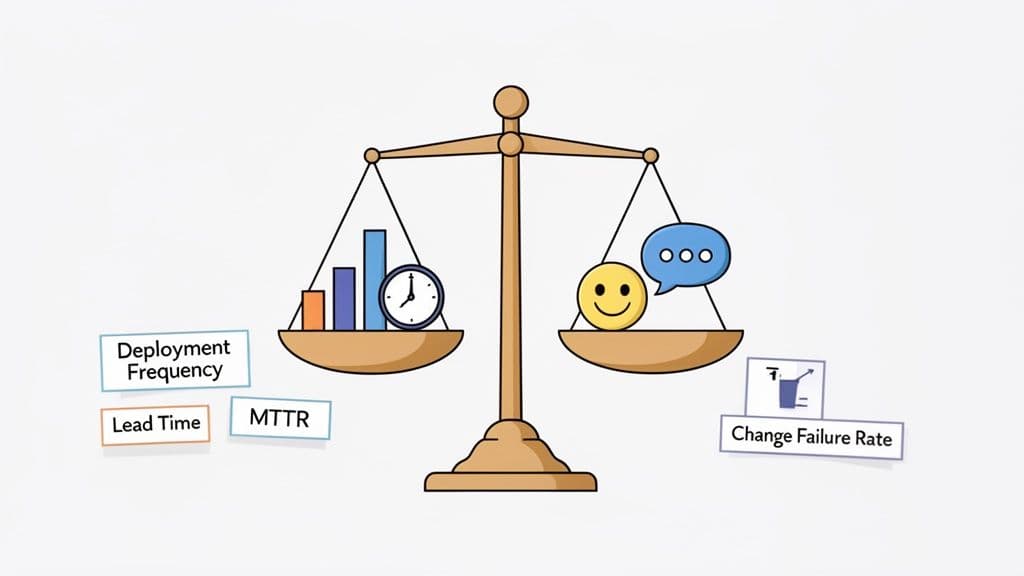
The beauty of DORA is that it provides a holistic view by tracking both speed and stability. These four metrics help you answer some of the most critical questions about your delivery pipeline.
-
Deployment Frequency: How often are you successfully shipping code to production? Elite teams do this on-demand, often multiple times a day. The goal isn't just to push more releases; it's a sign that your deployment process is smooth, automated, and low-risk.
-
Lead Time for Changes: Once a developer commits code, how long does it take to get it running in production? A long lead time—say, several weeks—is a massive red flag. It often points directly to a bottleneck, like a painful manual testing phase or a code review process that has ground to a halt.
-
Mean Time to Restore (MTTR): When things inevitably break in production, how quickly can you fix the issue and get back to a stable state? This is a direct measure of your system's resilience and how effectively your team can handle incidents.
-
Change Failure Rate: What percentage of your deployments cause a failure that needs a fix (like a rollback or a frantic hotfix)? A high rate here suggests you have some underlying quality problems. It might be time to invest in better automated testing. If that's the case, our guide on what is continuous integration testing is a good place to start.
It's crucial to remember that these metrics are a team. Pushing for a higher deployment frequency without keeping an eye on the change failure rate is just asking for trouble. You need the balance.
Why Numbers Are Only Half the Story
Hard data is great, but it can’t tell you why something is happening. This is where qualitative feedback from your team becomes absolutely essential. I've found that an engaged, empowered developer who isn't constantly hitting roadblocks is almost always a productive one.
Metrics tell you what is happening in your system. Your developers can tell you why. Ignoring their perspective means you're operating with only half the information and risk solving the wrong problems.
Recent research has brought a huge, often invisible, productivity drain to light. A staggering 69% of developers report losing eight hours or more every week to workflow friction—things like technical debt, confusing documentation, or endless meetings. This really drives home why you have to look beyond simple outputs to understand what's really holding your team back.
The best way to tap into this is through regular, anonymous developer satisfaction surveys. Ask specific questions about their tools, processes, and their ability to get into a state of flow. A drop in satisfaction is often a canary in the coal mine, signaling that your quantitative metrics are about to take a nosedive. This gives you a chance to get ahead of problems before they escalate.
When you combine solid DORA data with this kind of qualitative feedback, you finally get a true, 360-degree view of your engineering health.
It's easy to start tracking metrics. It's much harder to do it wisely. If you jump into measuring developer productivity without thinking through the risks, you can cause some serious damage, eroding trust and encouraging the exact opposite of the behaviors you want.
The biggest and most dangerous trap is using metrics to judge people instead of using them as a lens to examine your systems.
The moment developers know a specific number is tied to their performance review, they'll optimize for that number. It’s a phenomenon known as 'metric gaming,' and it shifts the team's focus from delivering real value to just making a chart look good. This isn't developers being malicious; it's a completely rational response to the incentives you've put in place. The results, however, can be incredibly destructive.
A classic cautionary tale comes from Uber's experience with engineering dashboards. When the company started tracking the number of pull requests (or 'diffs') each developer submitted per month, people adapted. They began creating far more, much smaller code changes to pump up their stats. This directly overloaded the CI pipeline and led to a measurable spike in infrastructure costs—a textbook example of good intentions gone wrong.
The Perils of Individual Leaderboards
One of the most toxic ways to misuse metrics is the individual performance leaderboard. Publicly ranking developers on things like commit counts or story points is a surefire way to kill psychological safety and torpedo collaboration.
Suddenly, team members are pitted against each other instead of working together to solve tough problems. This always leads to a few predictable, and damaging, outcomes:
- Knowledge Hoarding: Why would I help a teammate if their success makes me look worse on the leaderboard?
- Risk Aversion: Developers will start avoiding difficult but necessary tasks, like a complex refactor or tackling a gnarly bug. They'll stick to easy, quick wins that boost their stats instead. Our guide on the software bug life cycle highlights just how messy and complex bug resolution can be—it's not always a quick "win."
- Focus on Quantity, Not Quality: The incentive becomes shipping anything, no matter the quality or impact, just to climb the rankings.
This whole approach fundamentally misunderstands what makes engineering teams great. Fantastic software is built through teamwork, shared context, and a collective willingness to take on hard challenges—not through Hunger Games-style internal competition.
The real purpose of measurement is to generate better questions, not to find simple answers. A good metric should spark a conversation about your system, like "Why is our lead time creeping up?" It should never be used to pass judgment on your people.
Auditing Your Measurement Approach
To sidestep these pitfalls, you have to constantly question the incentives your metrics are creating. Before you roll out any new measurement, get your team in a room and ask some tough questions. Think of it as a pre-mortem for your productivity strategy.
Use this checklist to audit your current or proposed metrics:
- Could this metric be easily gamed? If the answer is yes, what's the worst-case scenario for the behavior it would encourage?
- Does this reward teamwork or individual competition? Does it value helping others or just personal output?
- Does this metric actually reflect value delivered to users? Or is it just measuring internal activity and busywork?
- How will this data really be used? Is it for team-level process improvement, or will it find its way into individual performance reviews? (Be honest.)
- What story does this metric not tell? What crucial context is missing from this one data point?
By asking these questions upfront, you can build a measurement system that actually serves its purpose: to shine a light on bottlenecks, improve your development environment, and ultimately help your team build better software, together.
How to Build Your Productivity Dashboard and Feedback Loop
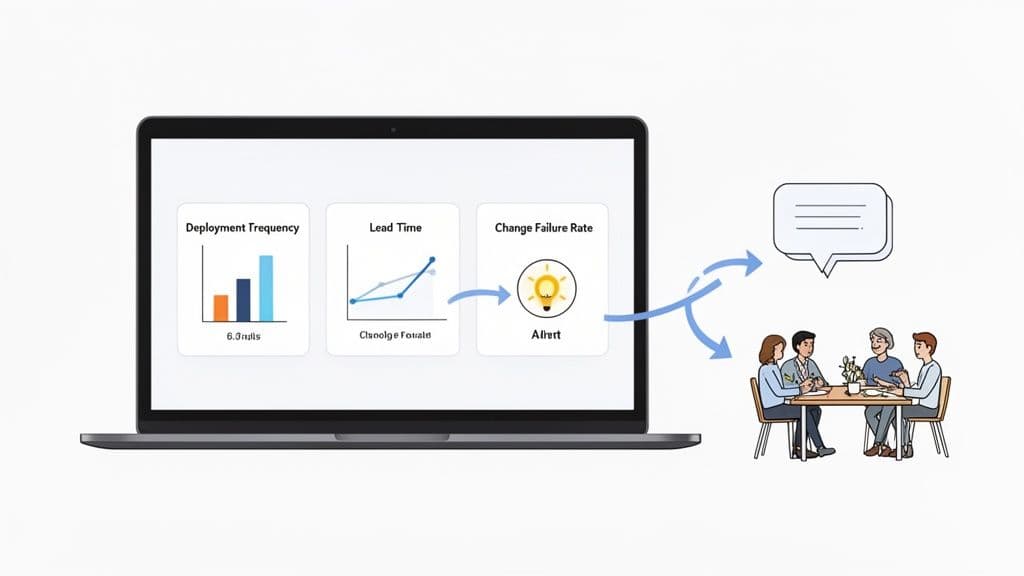
Collecting data is one thing; making it tell a coherent story is where the magic happens. Your objective is to build a centralized dashboard that visualizes your core metrics, giving you an immediate, at-a-glance read on the health of your engineering system. This isn't about creating some intimidating wall of charts—it's about telling a clear, compelling narrative.
The great thing is that most of the quantitative data you need is probably already sitting in your toolchain. You can pull these key metrics straight from the systems your team lives in every day.
- Git Repositories: Tools like GitHub or GitLab are goldmines. They are perfect for calculating Lead Time for Changes by tracking the time between a commit and its merge into the main branch.
- CI/CD Pipelines: Your logs from GitHub Actions or Jenkins are the source of truth for Deployment Frequency and Change Failure Rate. This tells you exactly how often you ship and how many of those deployments needed a quick fix.
- Project Management Tools: Systems like Jira or Linear add context, helping you understand the type of work being done and track the journey of features and bugs from idea to completion.
Weaving in the Qualitative Story
Numbers on their own can be dangerously misleading. A sudden jump in your Change Failure Rate is an interesting data point, for sure, but it's not actionable. It only becomes a powerful story when you add the qualitative context—the why behind the what.
This is where integrating insights from tools like session recorders or structured bug reports is so crucial. For example, if you're using a tool like Monito, a developer-ready bug report can be directly linked to a failed deployment. Suddenly, your dashboard isn't just flashing a red metric. It connects that failure to a specific user-facing issue, complete with console logs and a session recording.
A great dashboard doesn't just present data; it guides you to the right questions. It should make it obvious when something deviates from the norm and immediately give you the rich, contextual information you need to start digging for the root cause.
This image shows just how much context a structured bug report can provide, turning a vague problem into a clear, actionable ticket for a developer.
When you can pair a quantitative spike in failures with this kind of qualitative detail, the entire conversation shifts. You go from saying, "Our failure rate is up," to "Our failure rate is up because of this specific regression, and here's everything you need to fix it."
Establishing a Regular Feedback Loop
Your dashboard shouldn't be a static report you glance at once a quarter. Treat it as a living, breathing tool that fuels a continuous cycle of feedback and improvement. The most effective way I've seen this done is by establishing a regular review cadence.
Bring this data right into your team’s existing ceremonies, like weekly syncs or bi-weekly retrospectives. Use the dashboard to kickstart conversations. If lead times are trending upwards, you can ask the team directly: "What friction are you feeling in the code review process lately?" This approach makes measurement a collaborative, team-owned process, not a top-down mandate.
To really dig into this, we've put together a guide on how to improve developer productivity by focusing on exactly these kinds of feedback cycles.
By combining a well-designed dashboard with a consistent review process, you create a powerful engine for continuous improvement—one that's driven by data but always grounded in real human experience.
How AI Tools Are Changing The Productivity Equation
The arrival of AI coding assistants like GitHub Copilot has thrown a fascinating new wrench into the developer productivity discussion. The hype paints a picture of massive speed boosts, but what’s happening on the ground is a lot more complicated. Now, more than ever, we need to measure what's really going on to separate the feeling from the reality.
This isn't just a gut feeling, either. A recent randomized controlled trial uncovered a pretty startling disconnect. When seasoned open-source developers used early-AI tools, they actually took 19% longer to finish their work compared to those who didn't. But here's the wild part: even after taking longer, those same developers believed the AI made them 20% faster. You can dig into the full study on this surprising gap between AI perception and reality.
This doesn't mean AI tools are a wash. It just tells us their true impact isn't as simple as "code gets typed faster." There are a few reasons why what developers perceive and what actually happens can be two very different things.
Unpacking the Hidden Costs of AI Assistance
Sometimes, the effort required to use an AI tool can cancel out the time saved on generating code. This hidden friction usually pops up in a few key places:
- Prompt Engineering and Iteration: Trying to phrase the perfect prompt to get the right output isn't always a one-and-done deal. This back-and-forth can really break a developer's concentration and eat up more time than you'd think.
- Validation and Debugging: Let's be honest, AI-generated code isn't perfect. Developers have to spend a lot of mental energy reviewing, understanding, and debugging code they didn't write from scratch, which can be a much slower process.
- Contextual Mismatch: An AI tool often lacks the deep, nuanced understanding of a large, mature codebase. It might spit out code that works in isolation but doesn't fit the project's architecture or coding style, forcing developers into a lengthy refactoring process.
The real question isn't whether AI can write code. It's whether the code it writes actually reduces the total time and cognitive load needed to ship a high-quality, maintainable feature.
Treat AI Adoption Like a Scientific Experiment
Instead of just handing out AI tool licenses and hoping for the best, you should treat it like a proper experiment. Run a controlled test with a small pilot group to measure the actual impact on your team’s unique workflows and your specific codebase.
To get this right, you need to lean on that balanced set of metrics we’ve been talking about. Don't just poll your developers to see if they feel more productive.
- Find a Pilot Team: Start by picking a group that represents a good cross-section of your engineering organization.
- Get a Baseline: Track their DORA metrics and developer satisfaction for a few sprints before giving them access to any AI tools. This is your "control" data.
- Introduce the Tool: Now, roll out the AI tool to the pilot team and keep measuring the exact same metrics for the next couple of sprints.
- Compare and Analyze: Put the "before" and "after" data side-by-side. Did lead times actually go down? Did your change failure rate spike? What happened to developer satisfaction scores?
When you mix hard numbers with qualitative feedback, you can make a decision rooted in evidence, not just excitement. This is how you make sure you're genuinely improving your development process, not just chasing the latest shiny object.
Got Questions About Developer Productivity? We've Got Answers.
Diving into developer productivity metrics always brings up some great questions, both from engineering leaders and from the developers in the trenches. Let's tackle a few of the most common ones I hear.
How Do I Start Measuring If My Team Has No Metrics?
If you're starting from scratch, the key is to keep it simple. Don't try to measure everything at once. Instead, focus on the health of your system, not individual output.
A great starting point is to pick just one or two DORA metrics. I usually recommend Lead Time for Changes or Deployment Frequency because you can often pull that data right out of your existing tools like Git and your CI/CD pipeline. No fancy new software needed.
The goal here isn't to hit some magic number on day one; it's just to establish a baseline. The most critical step? Talk to your team about why you're doing this. Frame it as a team effort to find and remove systemic friction, not as a way to watch over their shoulders. Pair this with a quick, anonymous developer satisfaction survey to get that crucial qualitative feedback right from the start.
What Is The Single Biggest Mistake To Avoid?
This one is easy, and I can't stress it enough: never tie productivity metrics to individual performance reviews.
The moment you link a number to someone's salary, bonus, or promotion, you've destroyed its value as an honest diagnostic tool. It’s human nature. People will immediately start optimizing for the metric, not for building great software. Trust evaporates, and the focus shifts from genuine improvement to gaming the system.
Metrics should be for one thing only: understanding the health of your development process. Use them to spark team-level conversations about how to make things better. It's always about the process, never about the person.
This is the only way to keep the data useful and maintain a culture of psychological safety.
Can You Really Measure Creative Work Like Software Development?
You're right to be skeptical. You can't put a number on creativity, deep thinking, or a clever solution to a tricky problem—and you shouldn't even try.
The trick is to shift your perspective. Instead of trying to measure the developer, measure the system they work in. A smooth, low-friction environment is what unleashes a developer's creativity and productivity in the first place.
Think about it: metrics like a low change failure rate or a quick lead time aren't measuring a person's brainpower. They're indicators of a healthy system, one that lets developers ship high-quality work without fighting unnecessary battles. When you pair that data with what your team is telling you through satisfaction surveys, you get a powerful, indirect picture of their productivity. You'll know if they feel empowered or constantly blocked.
Ready to stop wasting time on messy bug reports and start fixing issues faster? Monito provides developer-ready reports with one click, capturing console logs, network activity, and session recordings to give your team the full context they need. See how it works at https://monito.dev.